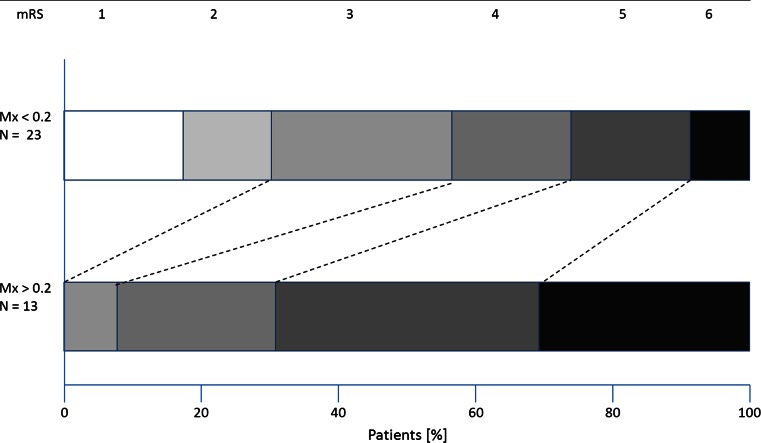
Fig. 3.
Three-month outcome in patients with high Mx and with low Mx. In patients with low Mx (Mx < 0.2; N = 23) the distribution of mRS scores (upper bar) was shifted towards lower scores (indicating better outcome) if compared to the mRS scores of the patients with high Mx (Mx ≥ 0.2; N = 13; lower bar). In seven patients mRS was either 2 or 1, in all of them Mx was low. The difference between outcome distributions of both groups was significant (p < 0.005; Mantel–Haenszel test). mRS modified Rankin Scale, 0 no symptoms–6 death)

