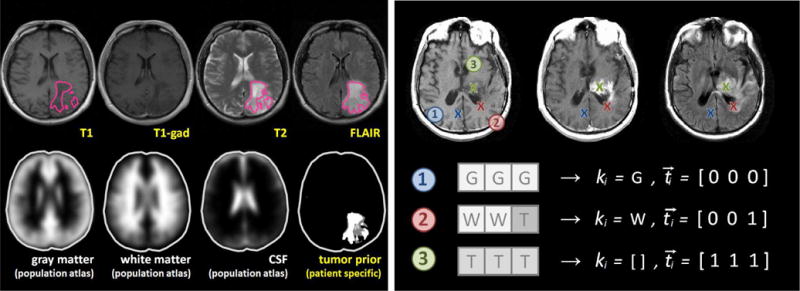
Fig. 2.

Illustration of the probabilistic model. The left panel shows images of a low-grade glioma patient with lesion segmentations in the different channels (outlined in magenta); in the bottom row it shows the probabilistic tissue atlases used in the analysis, and the patient-specific tumor prior inferred from the segmentations in the different channels. The right panel shows three voxels i with different labels in T1-, T1c- and FLAIR-MRI for a high-grade glioma patient. In voxel 1 all three channels show the characteristic image intensity of gray matter (G). In voxel 2 white matter (W) is visible in the first two channels, but the third channel contains a tumor-induced change (T), here due to edema or infiltration. In voxel 3 all channels exhibit gray values characteristic of tumor: a hypo-intense signal in T1, a hyper-intense gadolinium uptake in T1c – indicating the most active regions of tumor growth – and a hyper-intense signal in the FLAIR image. The initial tissue class ki remains unknown. Both ki and ti are to be estimated. Inference is done by introducing a transition process – with latent prior αi (Fig. 1) – which is assumed to have induced the channel-specific tissue changes implied by in the tumor label vector ti.
