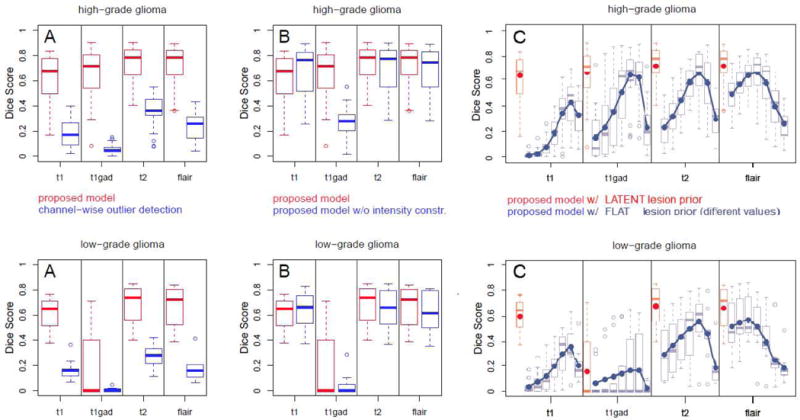
Fig. 3.

Evaluation of the generative model and comparison against alternative generative modeling approaches: high-grade (top) and low-grade cases (bottom). Reported are Dice scores for channel-specific segmentations for both low- and high-grade cases in the BRATS training set calculated in the lesion area. Boxplots indicate quartiles, circles indicate outliers. Results of the proposed model are shown in red, while results for related but different generative segmentation methods are shown in blue. Figure A reports performances of univariate tumor segmentations similar to [51]. Figure B: performances of our algorithm with and without constraints on the expected tumor intensities indicating their relevance. Figure C: performance of a generative model with “flat” global tumor prior αflat – i.e., the model of the standard EM segmenter – and evaluating seven different values αflat ∈ [.005, …, .4]. Blue lines and dots in C indicate average Dice scores. The proposed model outperforms all tested alternatives.
