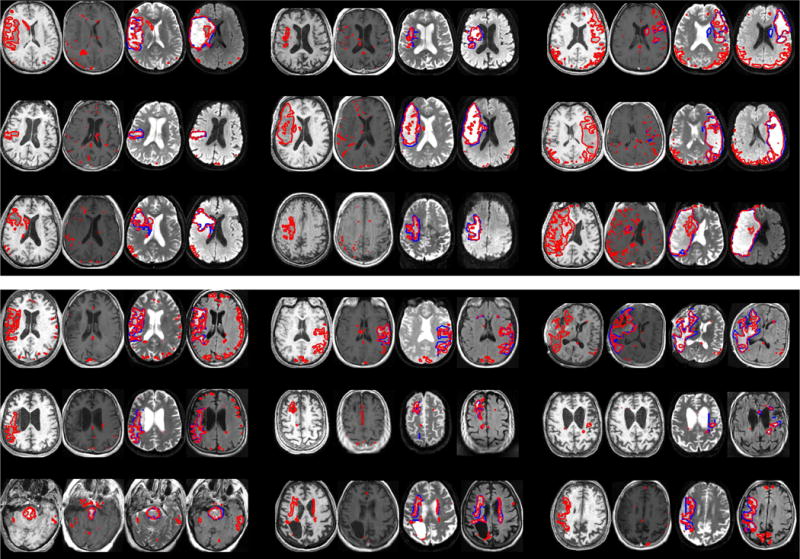
Fig. 5.

Generalization to ischemic stroke cases (showing acute stroke: rows 1–3; subacute stroke: rows 4–6) with T1, T1c, FLAIR/MD, T2/MAD images of each patient (from left to right, three patients per row). Automatic segmentations are delineated in red, lesions in manually segmented volumes are shown in blue (typically beneath a red line); T1 and T1c lesions were only visible for some cases.
