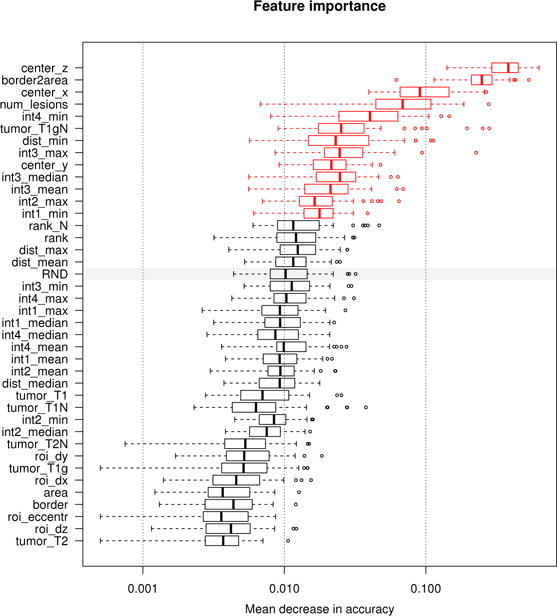
Fig. 6.

Measuring feature relevance of the discriminative model. Features relevant for discriminating between false positives and true positives regions. We evaluate the permutation importance [67] of each feature extracted for the FLAIR regions (see text for details). Boxplots show the decrease in accuracy for all 255 trees of the oblique random forest (boxes representing quartiles) with high values indicating high relevance. The gray bar indicates the performance of a random feature (“RND”) under this measure, features displayed in red perform significantly better (as indicated by a paired Cox-Wilcoxon test at 5% level). Location and shape of the regions are most discriminative, as well as the general number of lesions visible in the given FLAIR image, and selected image intensities.
