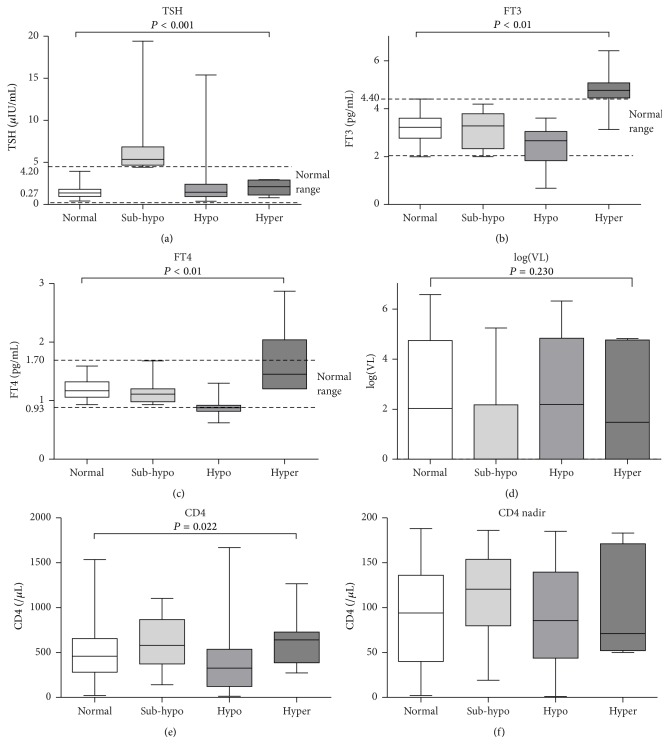
Figure 1.
Thyroid hormone levels, HIV loads, and CD4 cell counts in patients with different thyroid function. FT3, free tri-iodothyronine; FT4, free thyroxine; TSH, thyrotropin; VL: viral load. Normal: normal thyroid function; sub-hypo: subclinical hypothyroidism; hypo: overt hypothyroidism; hyper: overt hyperthyroidism. The horizontal lines represent mean values, the boxes represent standard deviations, and the whiskers represent ranges. The dashed lines represent the normal ranges of thyroid hormones. The P values in the figure were acquired using χ 2 tests of the whole sample and not from comparisons between any two means.

