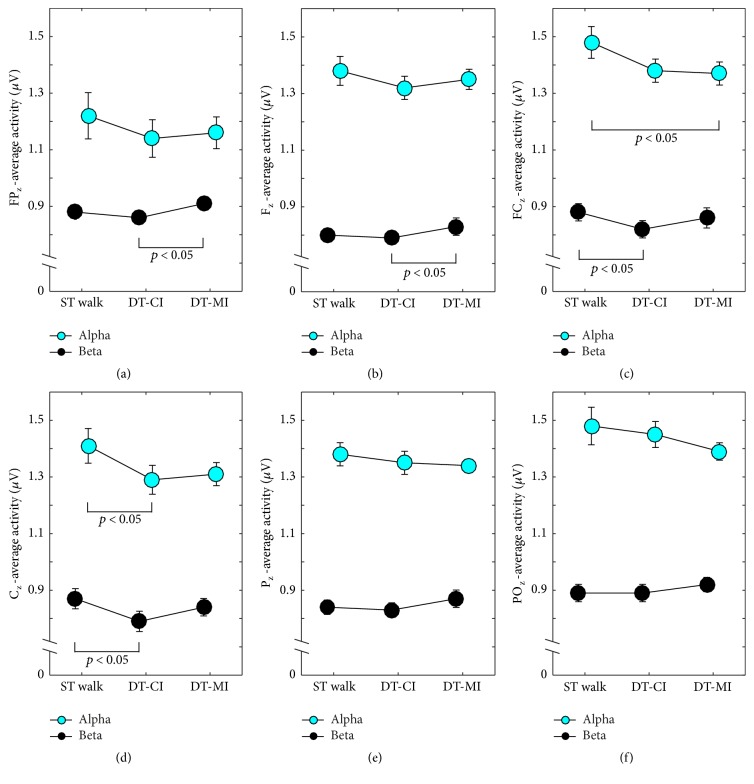
Figure 2.
Subjects' mean average voltage across the cranial midline, separated by condition (ST walk: single-task walking, DT-CI: walking + cognitive interference, DT-MI: walking + motor interference). Values represent average voltage for (a) FPz, (b) Fz, (c) FCz, (d) Cz, (e) Pz, and (f) POz. Cyan circles represent mean alpha frequency; black circles show mean beta frequency; error bars represent the respective 95% confidence interval.

