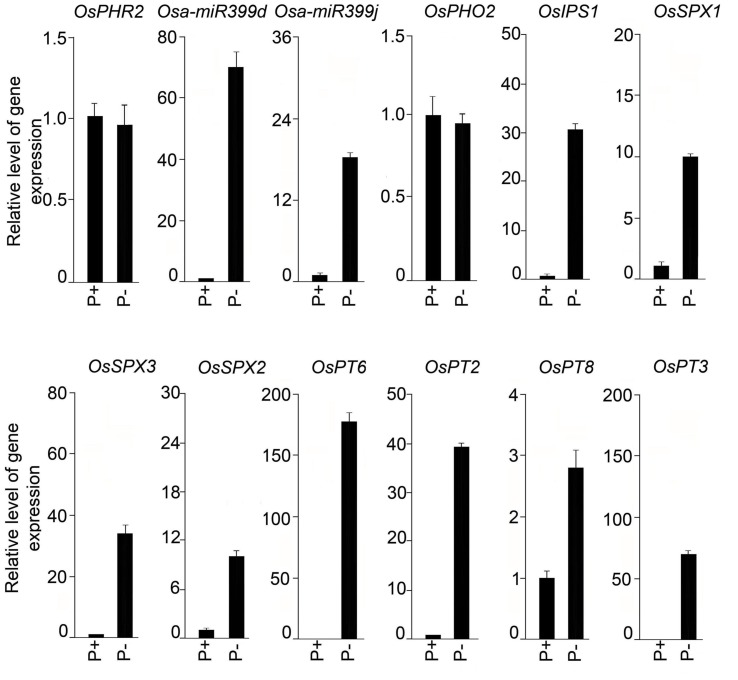
FIGURE 10.
Effects of Pi deficiency-mediated responses of genes involved in Pi homeostasis. Real-time PCR analysis of relative expression levels in roots of MI48 seedlings grown under P+ and P- conditions for 7 days. OsRubQ1 was used as an internal control. Data presented are means of six technical replicates ± SE.

