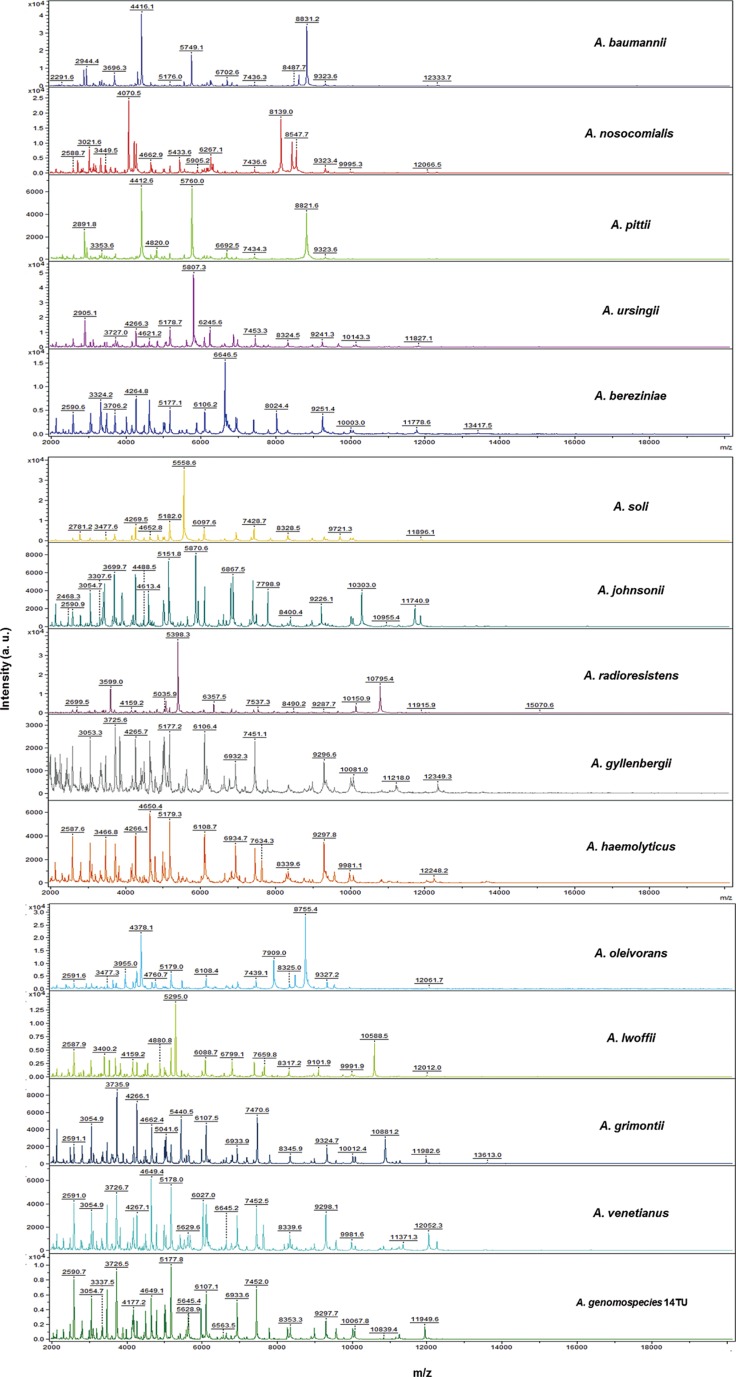
Fig. 2. Peak profiles of 15 representative Acinetobacter species generated by matrix-assisted laser desorption ionization-time of flight mass spectrometry (MALDI-TOF MS). The mass-to-charge (m/z) ratios of the ions are shown on the x-axis, and the absolute intensities of the ions are presented on the y-axis. AU values were given by the software.
Abbreviation: AU, arbitrary intensity.

