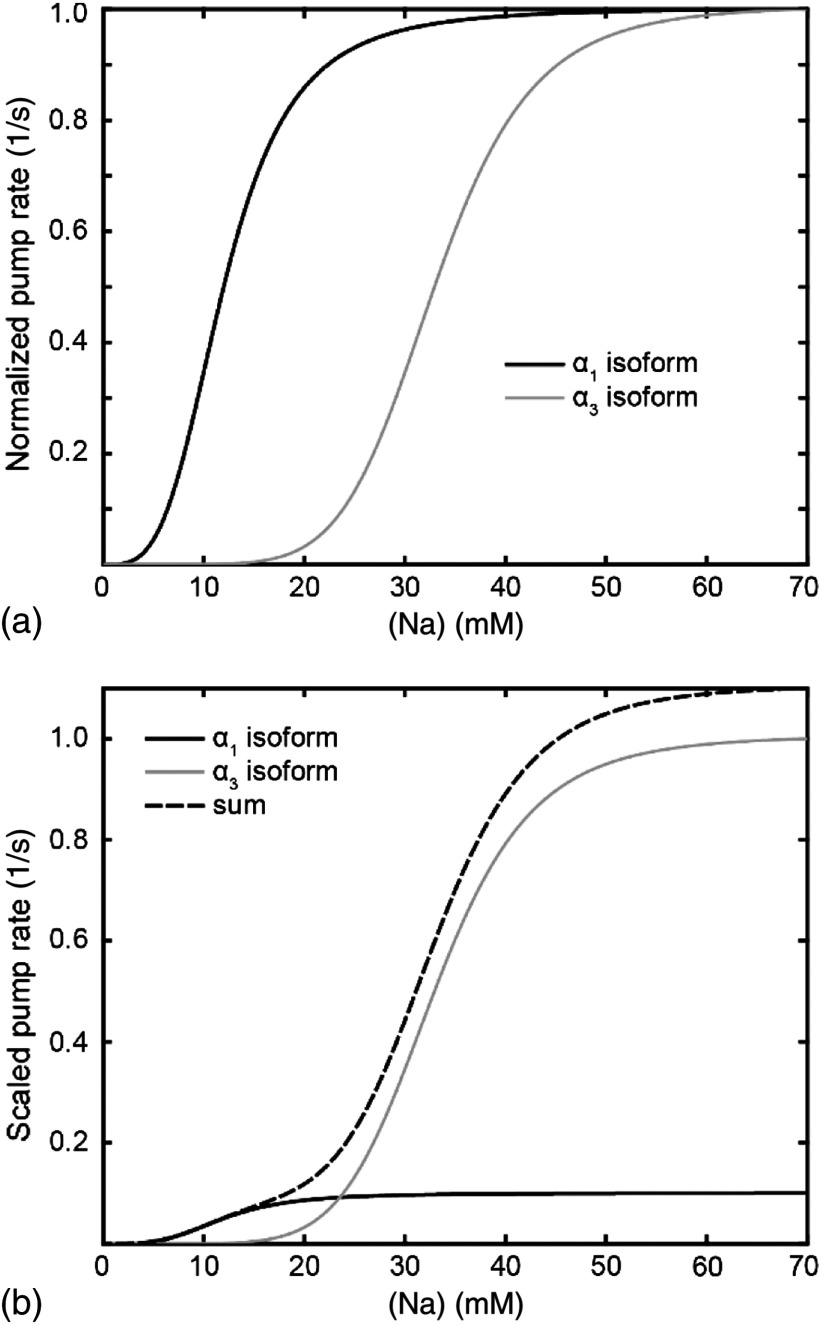
Fig. 5.
Enzyme kinetics of the ubiquitous isoform and the neuron specific isoform. (a) Kinetics data taken from Zahler et al.15 Normalized pump rates for (black line) and (gray line) as a function of sodium concentrations. (b) The 50% intracellular sodium affinity value () is 12 mM for and 33 mM for , and the Hill coefficient is 3.5 for and 6.8 for . Pump rates for both isoforms scaled to reflect the difference in maximum rate, so that the neuron specific isoform (gray line) has a 10 times higher maximum turnover rate than (black line). Additionally, the summed pump rate from combining (equal amounts of) the isoforms is also shown (black-dashed line).

