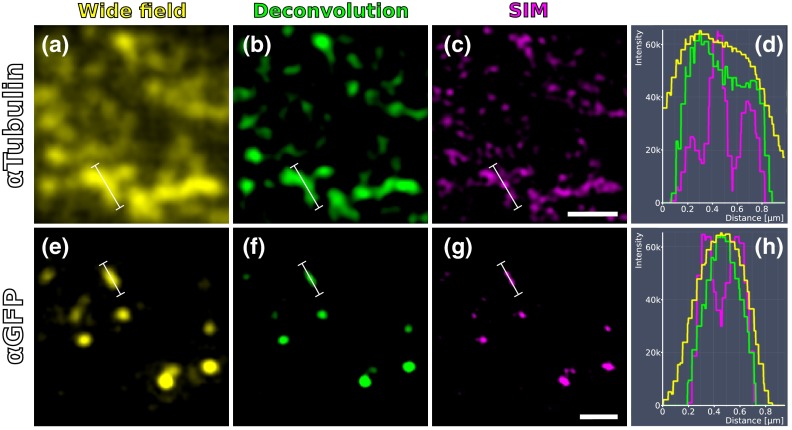
Fig. 7.
Comparison of SIM and conventional fluorescence microscopy with and without deconvolution. (a) Wide-field fluorescence image of anti-tubulin staining on a 100-nm LR White section of the RVG of C. elegans. (b) Same region as in (a), but after deconvolution algorithm was applied. (c) Same region as in (a) and (b), but after super-resolution SIM algorithm was applied. (d) Intensity profile of the three imaging methods reveals that SIM makes it possible to discern more individual signals than deconvolution. The white lines in (a)–(c) correspond to the intensity profile displayed in (d). (e)–(h) Same as in (a)–(d), also the same section, but with anti-GFP staining displayed. Scale bars: .

