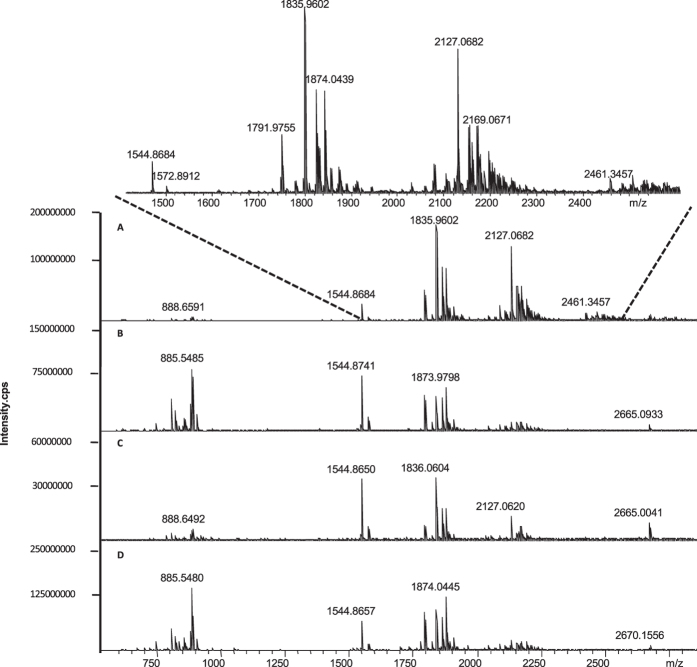
Figure 5. Mass spectra of brain tissue sections obtained by MALDI-FTICR MS in negative ion mode.
(A) Brain tissue section was pretreated by 70% EtOH and 95% EtOH each for 30 s and 3-AQ (30 mg/mL)/ammonium formate (125 mM) as matrix; (B) No treatment for brain tissue section, and 3-AQ used as matrix; (C) Brain tissue section was pretreated similarly with A, but no ammonium formate was used; (D) No treatment for brain tissue section, and 3-AQ (30 mg/mL)/ammonium formate (125 mM) as matrix.

