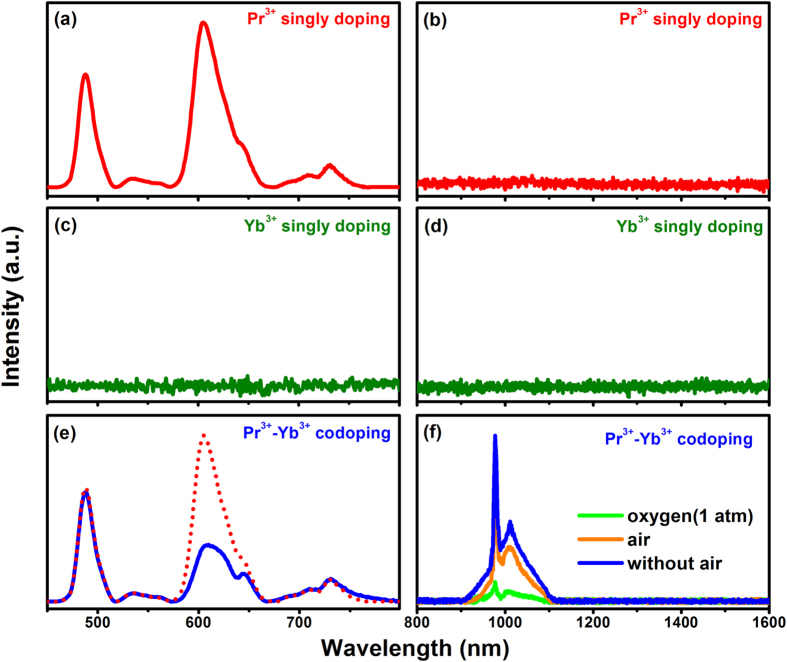
Figure 2.
The LPL spectra of the Pr3+ (a,b), Yb3+ (c,d) single doped and Pr3+-Yb3+ codoped (e,f) samples recorded at 30 s after ultraviolet (UV) lamp (254 nm) irradiation for 15 min, the red dots are the LPL spectra of Pr3+ single doped sample for comparison and and the (f) shows the LPL spectra in different atmospheric preparation condition.

