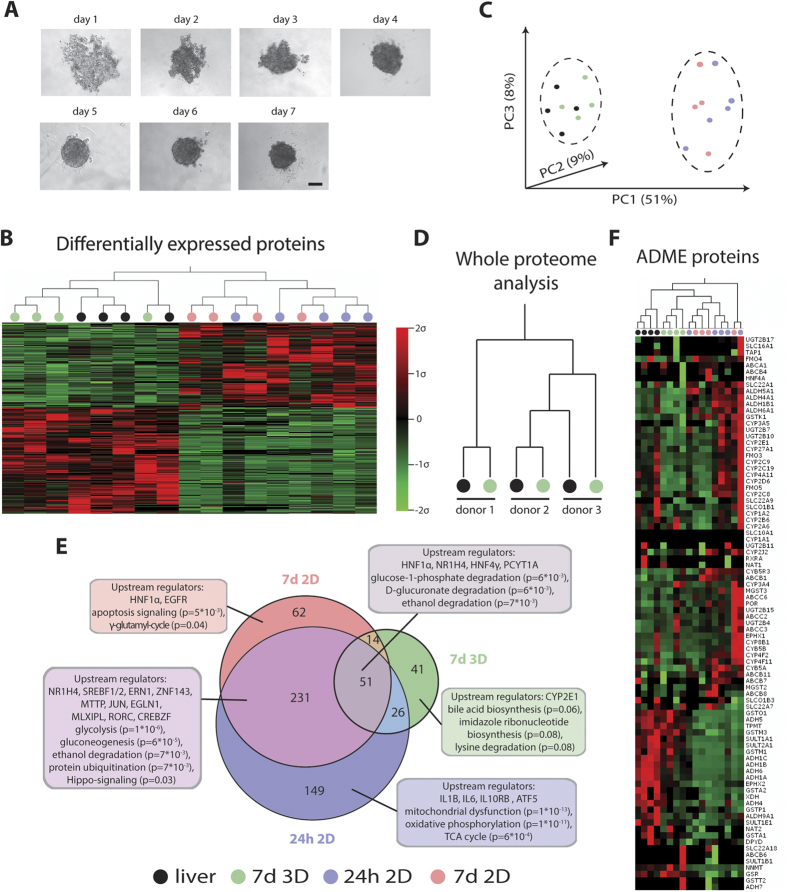
Figure 1. 3D spheroids from PHH closely resemble the in vivo liver at the proteome level.
(A) Time series showing progressing spheroid aggregation over time. Spheroid formation was judged complete after 7 d when a well-defined perimeter could be observed. Scale bar = 100 μm. (B) Heatmap visualizing whole proteome analysis of primary human liver samples (n = 5) after 24 h and 7 d in 2D monolayer culture and spheroids after aggregation (7 d 3D). Only differentially expressed proteins (n = 574 proteins, p < 0.05, F-test) are shown. Note that in vivo liver samples (black) and spheroids (green) cluster closely together while the proteomes of samples cultured in 2D (24 h = blue; 7 d = red) are distinctly different. (C) Principle component analysis separates proteomes from liver and PHH spheroids from 2D monolayer-cultured samples. (D) In vivo phenotypes are preserved in 3D culture, with each of the 3D samples clustering with the respective liver piece from the same donor. (E) Venn diagram showing differentially regulated pathways after 24 h 2D, 7 d 2D and 7 d 3D as suggested by GSEA. Numbers in circles indicate numbers of differentially expressed genes compared to liver with p < 0.05. Extensive misregulation of a variety of important metabolic and signaling pathways is observed in 2D such as glycolysis, gluconeogenesis, Hippo-signaling and apoptosis. In contrast, the proteomes of 3D PHH spheroid cultures closely resemble in vivo livers. Indicated p-values are after Benjamini-Hochberg multiple testing correction. (F) Heatmap showing all proteins involved in absorption, distribution, metabolism and excretion (ADME) of compounds that we detected in our dataset. Note that livers and PHH spheroids cultures cluster together, similar to when whole proteomes are considered.

