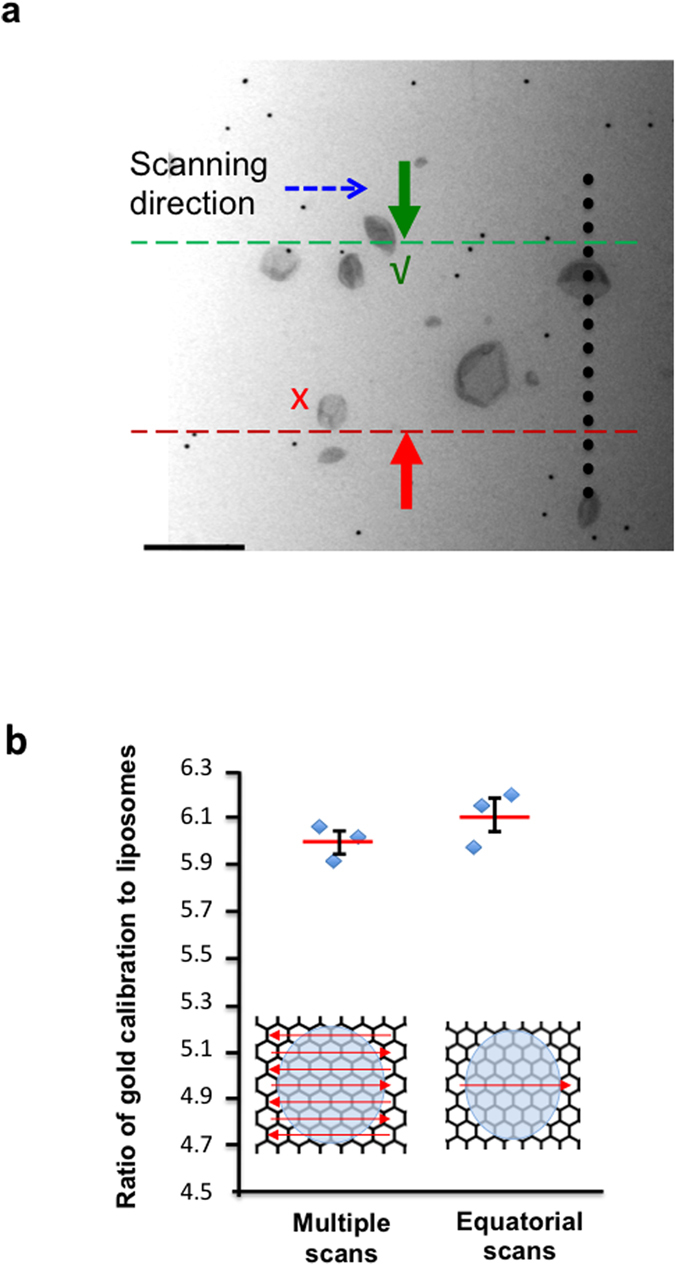
Figure 5. Quantification of nanoparticles using gold particle calibration.

(a) During scanning gold particles and test nanoparticles were imaged “live” using a digital camera and counted using a scanning band as described in the text and in Fig. 4. The tip of the green arrow traces the acceptance line (dashed green) and red arrow the forbidden line (dashed red) during translocation of the specimen. The liposome (nanoparticle) concentration was estimated from the ratio of golds to liposome (nanoparticle) multiplied by the gold calibrant concentration. (b) Estimates of gold/nanoparticle ratio from single equatorial scans closely match those obtained from multiple SUR scans. Number estimates were obtained from the same grid but in different locations for each type of sample (n = 3, mean value and bars standard error of mean). Scale bar, 500 nm.
