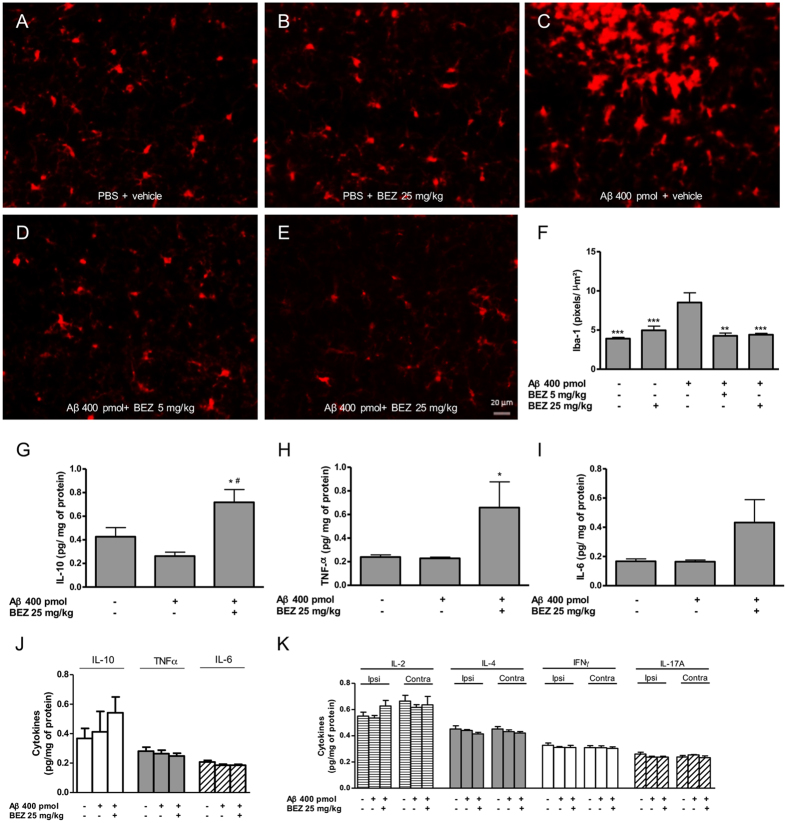
Figure 3. Effect of BEZ on microglia and cytokines expression 8 days after Aβ injection.
Representative Iba-1 slides of ipsilateral hippocampus at a 10X magnification in different treatment groups PBS + vehicle (A), PBS + BEZ 25 mg/kg (B), Aβ + vehicle (C), Aβ + BEZ 5 mg/kg (D) and Aβ + BEZ 25 mg/kg (E). Bar graph summarizing the results of the quantification of Iba-1 data in the ipsilateral hippocampus (F). Quantification of IL-10, TNF-α and IL-6 data in the ipsilateral (G,H,I), respectively) and the contralateral (J) hippocampi. Quantification of IL-2, IL-4, IFN-γ and IL17A in ipsilateral and contralateral hippocampi (K). Results are expressed as mean ± SEM. *p < 0.05, **p < 0.01 and ***p < 0.001 as compared to Aβ + vehicle; #p < 0.05 as compared to PBS + vehicle (one-way ANOVA followed by Newman-Keuls test).

