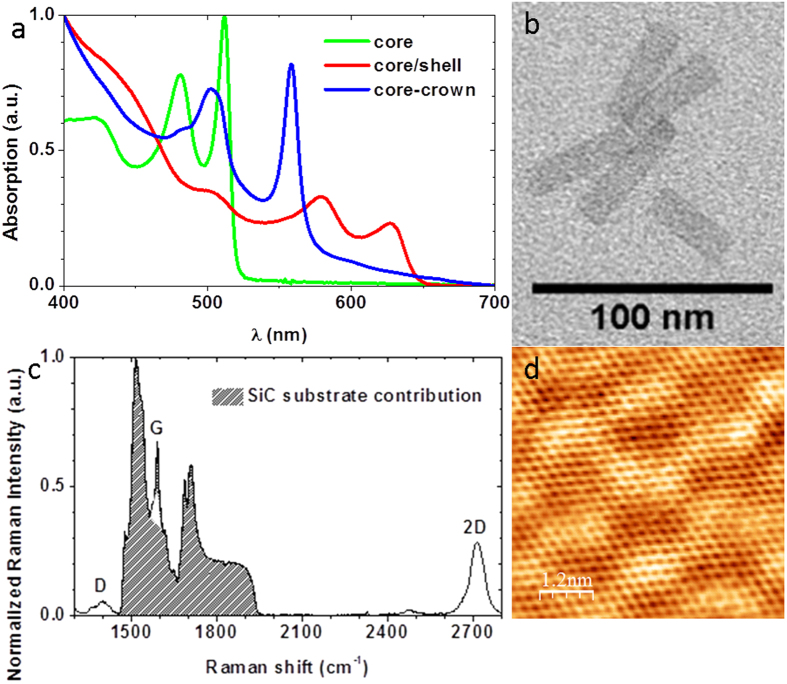
Figure 1.
(a) Absorbance spectra of a suspension of CdSe core (green line), CdSe/CdS core/shell (red line) and CdSe-CdTe core-crown (blue line) nanoplatelets. (b) TEM picture of CdSe core nanoplatelets. (c) Raman spectra of a hydrogenated graphene layer on the Si-face of 4H-SiC. (d) STM image (−50 mV, 0.1 nA) of such a graphene sample.

