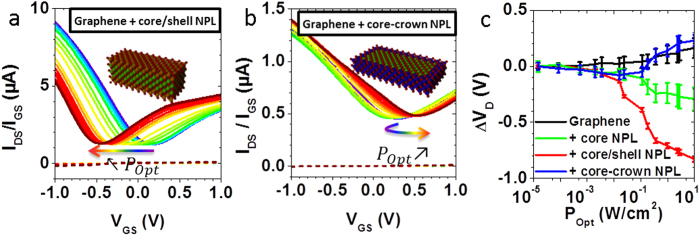
Figure 5.
Transfer curves under increasing illumination power (see Fig. 2a for the legend) for (a) CdSe/CdS core/shell NPL – graphene phototransistor; (b) CdSe-CdTe core-crown NPL – graphene phototransistor. (c) Displacement of the Dirac point voltage versus incident optical power for graphene (black), graphene – CdSe core (green), graphene – CdSe/CdS core/shell (red), graphene-CdSe-CdTe core-crown (blue). The points are averaged over 3 to 6 devices, and the error bars represent the standard deviation to the mean.

