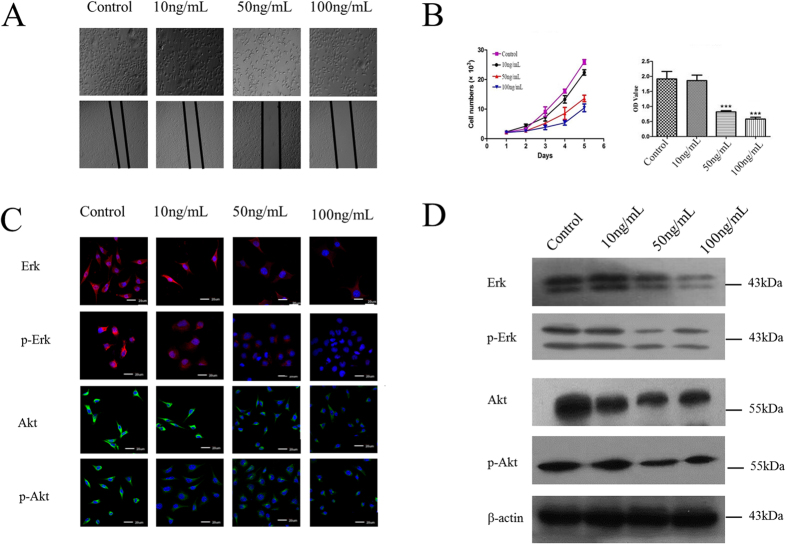
Figure 6. Effect of the aqueous extract of FC on cell proliferation and cell migration.
Data are expressed as mean ± S.D. (A) The morphology of SMMC-7721 cells (upper) and the result of wound-scratch assay (lower). (B) The results of Typanblue staining assay (left) and CCK-8 assay (right), “***” represented for p < 0.001. (C) Immunocytochemical staining showed Erk, p-Erk, Akt and p-Akt of four groups. (D) Western blot assay analyzed Erk, p-Erk, Akt and p-Akt of four groups.

