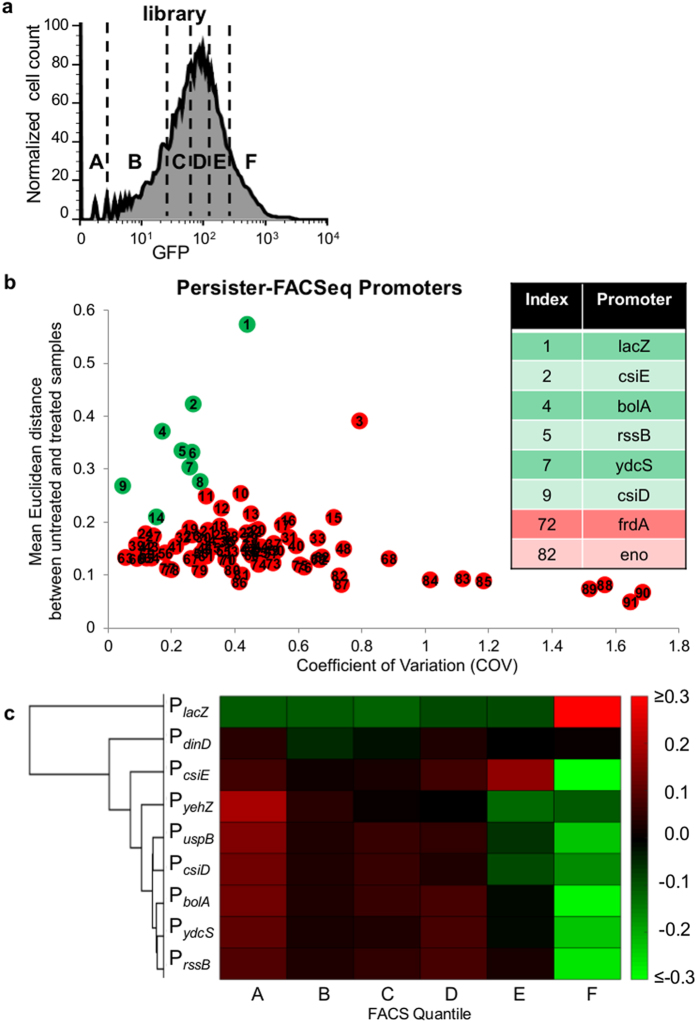
Figure 3. Persister-FACSeq identifies promoters with distinct normal cell and persister gene expression patterns.
(a) Fluorescence distribution of promoter reporter library [representative of n = 6 (two FACS experiments per Persister-FACSeq replicate, which was performed in triplicate for this study)]. FACS quantiles are designated by A-B-C-D-E-F. Fractions of the entire population sorted into each quantile were in general 0.25, 0.15, 0.15, 0.15, 0.15, 0.15 for A-B-C-D-E-F, respectively. (b) Plot of mean Euclidean distance between untreated and treated samples against coefficient of variation (COV) for each promoter (n = 3). Green markers represent promoters with Euclidean distances that are significantly different from Euclidean distances of randomized reads of the same promoter as determined using t-tests and a p-value ≤ 0.05 (Methods) (Supplementary Table S4), which indicates distinct normal cell and persister gene expression patterns. Red markers represent promoters with Euclidean distances not significantly different from Euclidean distances of randomized reads of the same promoter (t-test, p-value > 0.05). Inset lists promoters subjected to monoculture verification. (c) Hierarchical clustering of differences between persister proportions and normal cell proportions (Ppropand Nprop, colorbar represents the magnitudes of the differences) for promoters identified to have distinct normal cell and persister gene expression patterns. Replicates consist of ≥ 3 independent experiments.

