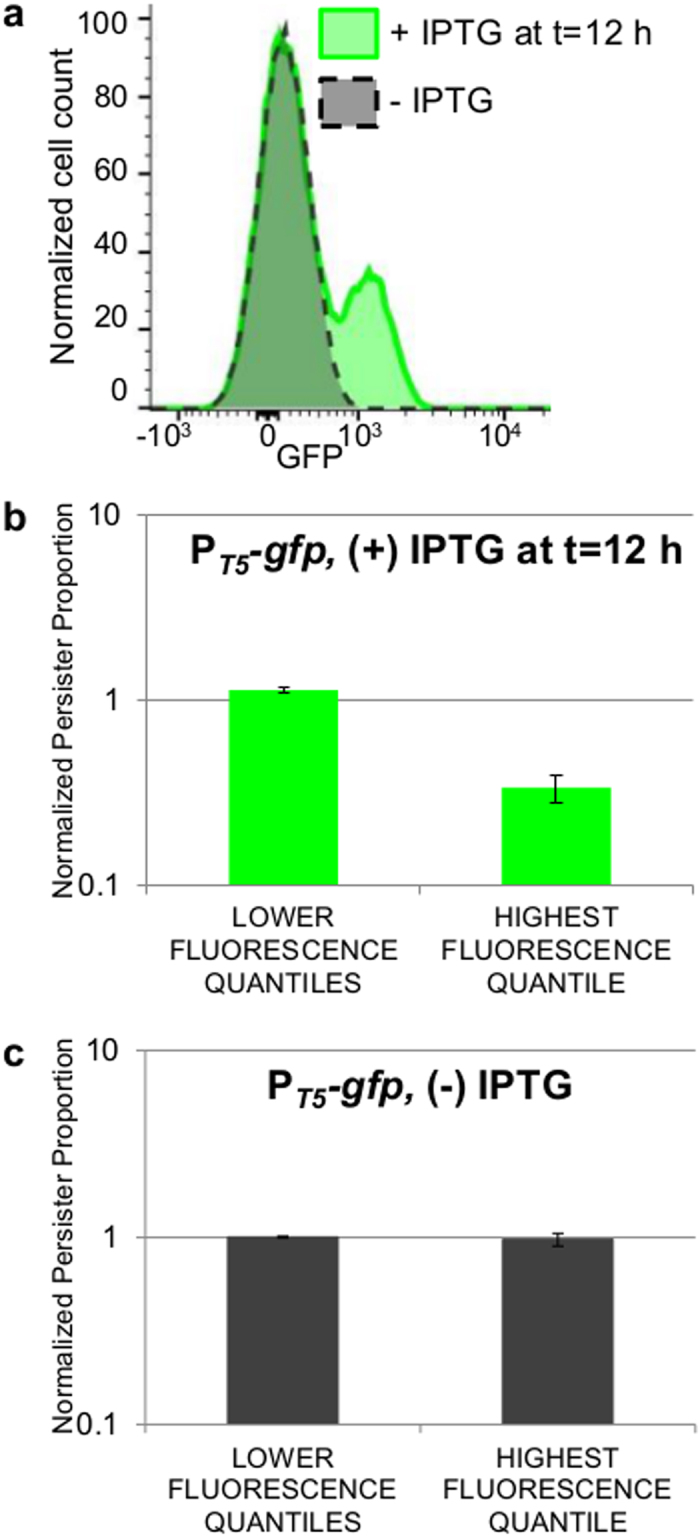
Figure 6. Active protein production in stationary phase correlates with low tolerance to ofloxacin.

(a) Fluorescence distribution of MG1655 bearing PT5-gfp at t = 16 h (+)/(−) IPTG induction at t = 12 h; representative of 3 biological replicates. (b) FACS and OFL tolerance assays were performed on the IPTG-induced PT5-gfp population (green histogram in (a)). FACS quantiles were set so that quantile D contained 10% of the entire population, quantile A contained the least number of events possible based on the resolution capabilities of the sorter, quantile C contained <3% of the fluorescent-negative sample (uninduced PT5-gfp), and quantile B contained the remainder of the population. LFQs demonstrate a statistically-significant ~3-fold higher NPP than that of the HFQ (t-test, p-value ≤ 0.05). Data are averages of 3 biological replicates; error bars portray s.e.m. (c) FACS and OFL tolerance assays were performed on an uninduced PT5-gfp population (gray histogram in (a)) using the gating strategy described in (b) except that quantiles B and C contained equal amounts of the population. LFQs and HFQ demonstrate equivalent persistence levels (t-test, p-value > 0.05). Data are averages of 3 biological replicates; error bars portray s.e.m.
