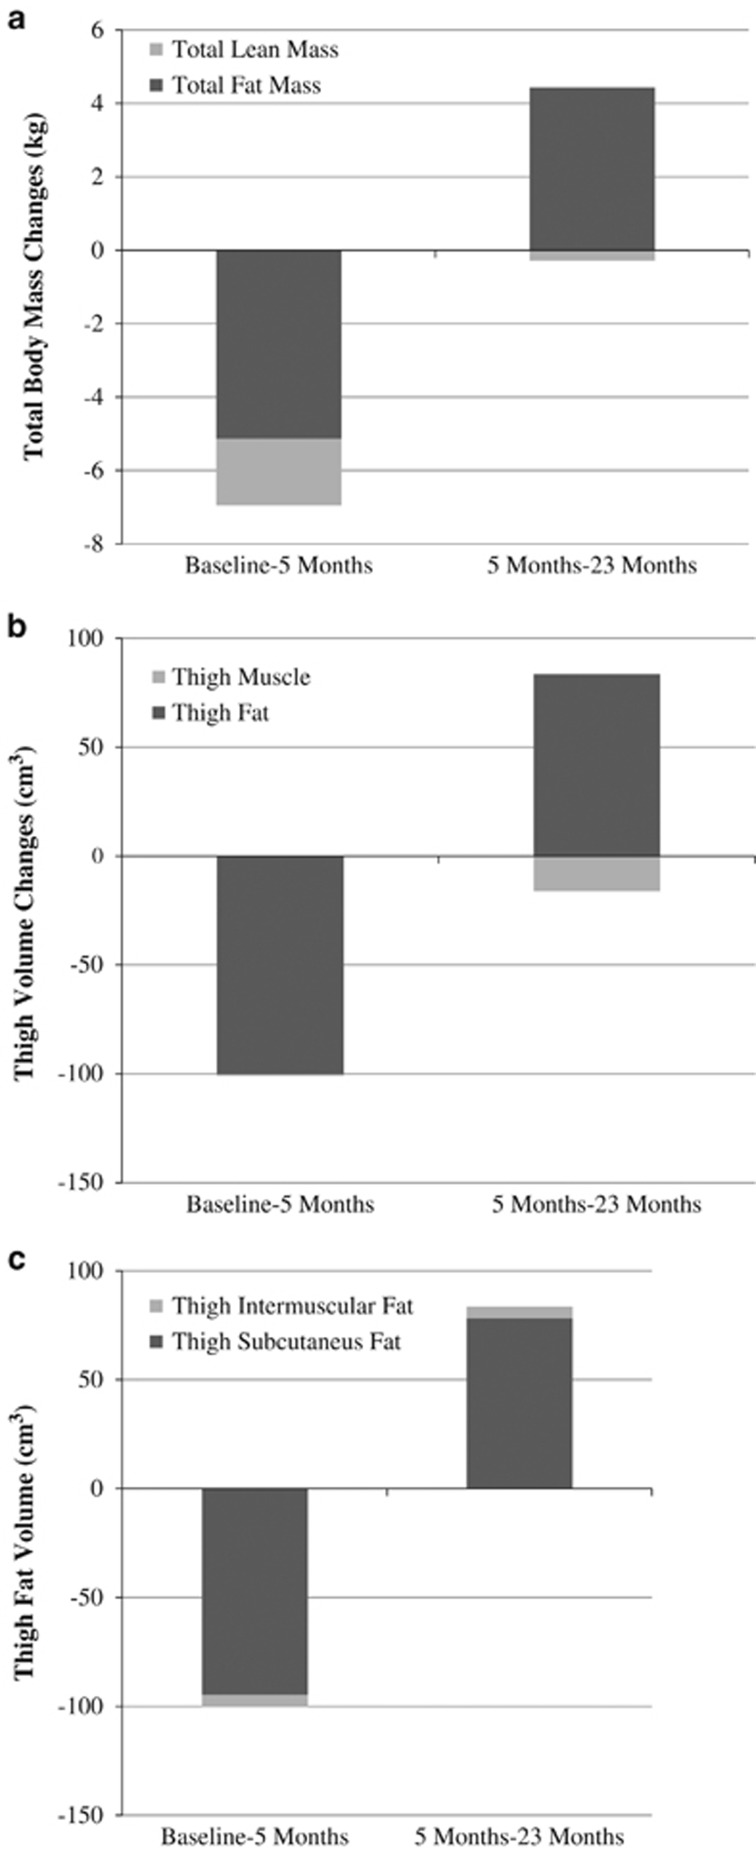
Figure 1.
(a) Change in total fat and lean mass during and after the intervention period (RT+CR group, only). (b) Change in total thigh muscle and fat volume during and after the intervention period (RT+CR group, only). (c) Change in thigh subcutaneous and intermuscular fat volume during and after the intervention period (RT+CR group, only).

