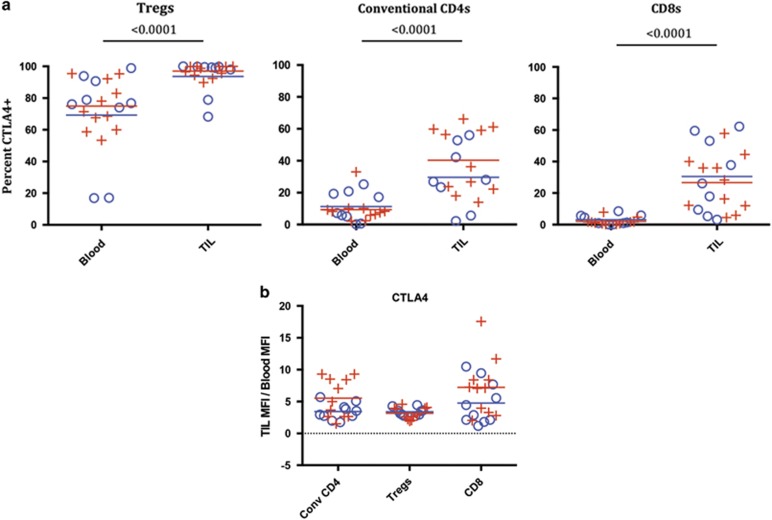
Figure 6.
Intracellular CTLA-4 expression on Treg, CD4 and CD8 T cells in HPV-positive and -negative patients. (a) The percentages of CTLA-4-positive T cells were quantified as shown in Figure 3 for Tregs, conventional CD4s and CD8s. Means for the HPV-positive and -negative groups are depicted as red and blue lines, respectively, in the plots; P-values are from non-parametric repeated-measures (blood, TIL) models of each cell type. ((+)=HPV positive, N=11), ((o)=HPV−, N=9) P-values for HPV+ vs − were not significant. (b) MFI: Tregs, convention CD4s and CD8 T cells were gated on as individual populations and evaluated for CTLA-4 MFI in the blood and TIL of head and neck cancer patients. Mean MFI are depicted as red and blue lines in the plots for mean fold-changes. Because of physical changes in our flow cytometer over the course of the study, the fold-change in MFI of TIL relative to blood was used to normalize the MFI data set and is shown for each subset of T cells. No significant difference in fold-increase for CTLA-4 MFI was found between HPV-positive and -negative patients. In a subset of samples with consistent cytometer settings, there was significant differences in the Treg population blood vs TIL (P=0.0002) and in the conventional CD4 population blood vs TIL (P=0.00039), as well as in the CD8 population (P=0.0002) (data not shown).

