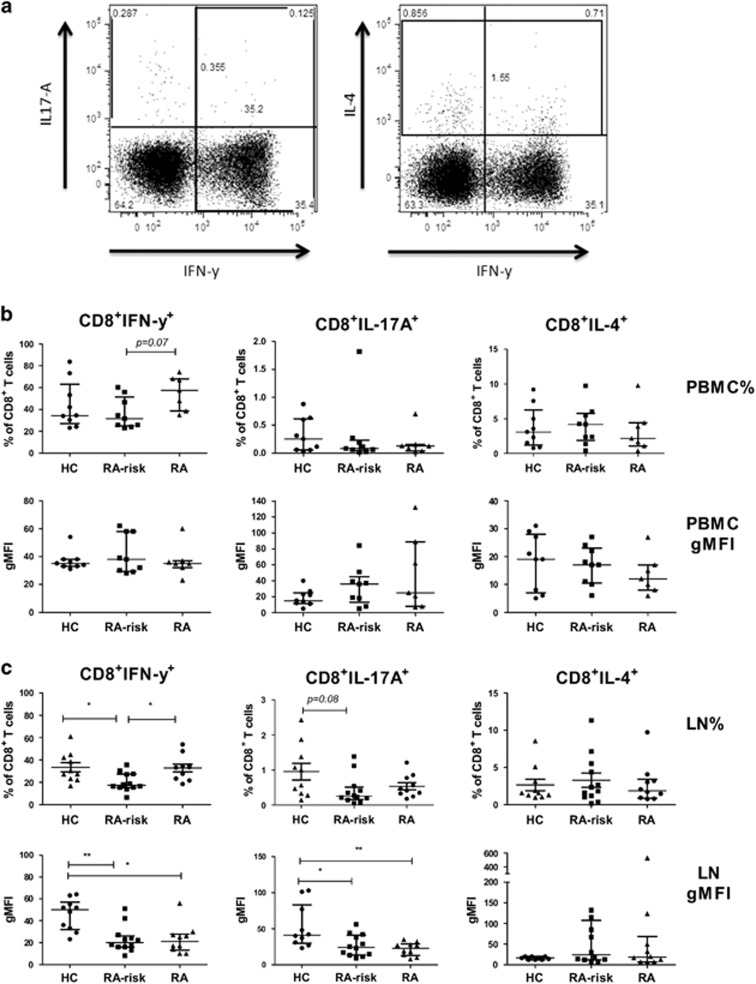
Figure 2.
Cytokine production in CD8+ T cells in PBMC and lymph node cells. Representative flow-cytometry dot plots for gated CD8+ cytokine producing T cells are depicted in (a). PBMC and lymph node cells are incubated for 4 h with phorbol myristate acetate (PMA) and Ionomycin in the presence of Brefeldin A and Golgi Stop and stained intracellularly. Frequencies (upper panels) of CD8+ T cells producing IFN-γ, IL-17A or IL-4 are analysed using flow cytometry for both PBMC (b) and lymph node tissue (c). Cytokine production per cell is analysed using gMFI (lower panel) for PBMC and lymph node cells. PBMC; HC (n=9), RA-risk (n=9), RA (n=7). Lymph node; HC (n=10), RA-risk (n=12), RA (n=10). All data are presented as median with IQR (*P<0.05; **P<0.01).

