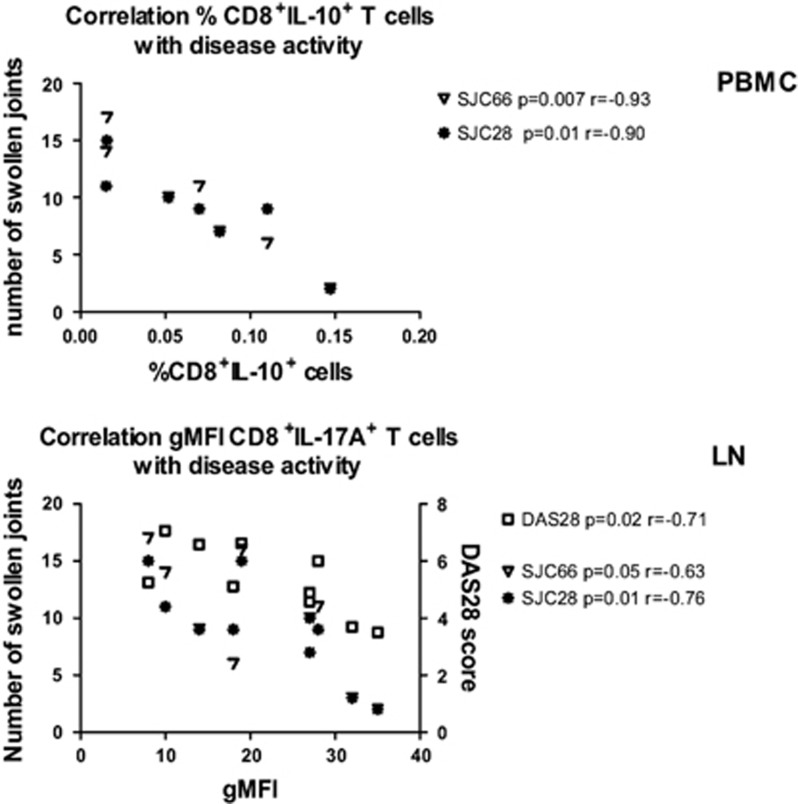
Figure 5.
Relationship between CD8+ T-cell subsets and disease activity in RA. The correlations between disease activity parameters (SJC66 and SJC28) and the frequency of CD8+IL-10+ T cells (n=7) in PBMC from RA patients are plotted in the upper panel. The correlations between disease activity parameters (DAS28, SJC66, SJC28) and IL-17 production in CD8+ T cells measured by gMFI (n=10) in lymph node tissue biopsies from RA patients are plotted in the lower panel.

