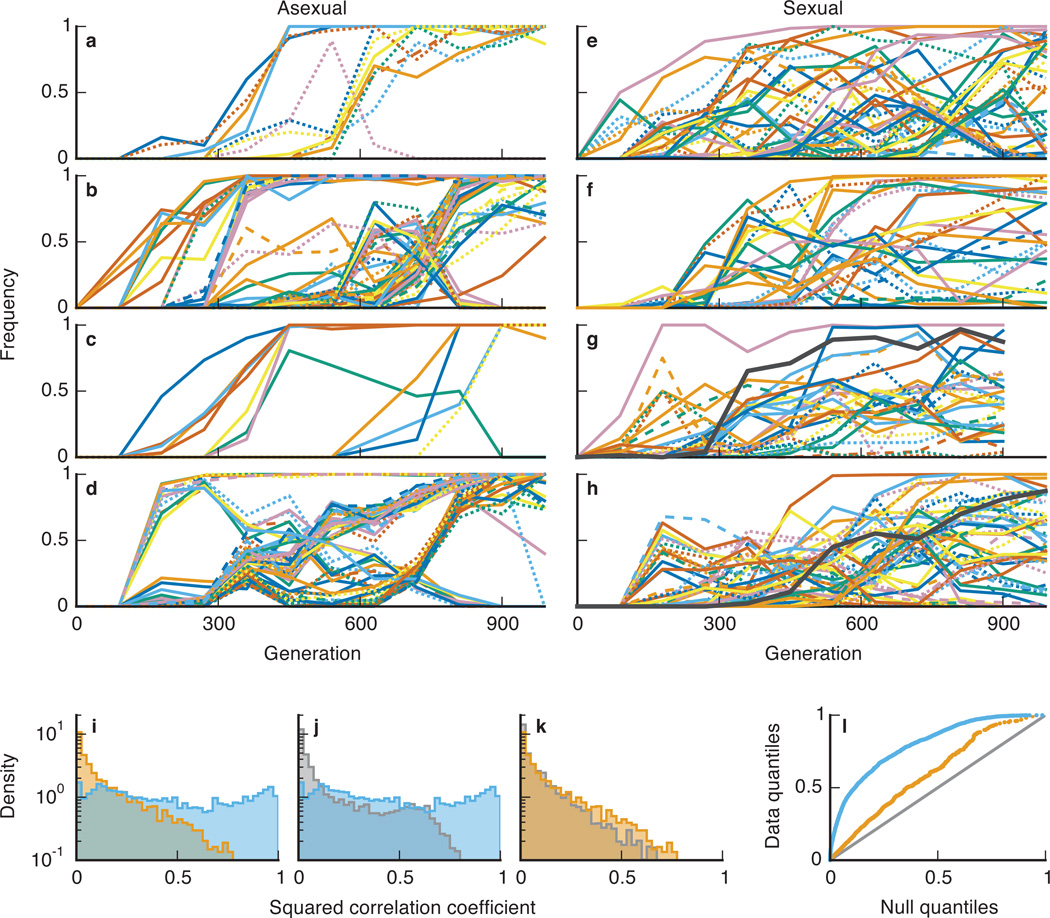
Figure 2. Fates of spontaneously arising mutations.
a–h, The frequencies of all identified de novo mutations through ~1000 generations in four asexual populations (a–d) and four sexual populations (e–h). Solid lines are nonsynonymous mutations; dashed are synonymous; dotted are intergenic. Black trajectories represent mutations in ERG3 subject to balancing selection. i, Distribution of correlations in frequency changes among pairs of trajectories in asexual (blue) and sexual (orange) populations. j,k, Comparison between these correlations and an empirical null distribution (gray) in asexual (j) and sexual (k) populations. l, Quantile-quantile plot summarizing deviations from null expectations (gray) in asexual (blue) and sexual (orange) populations.

