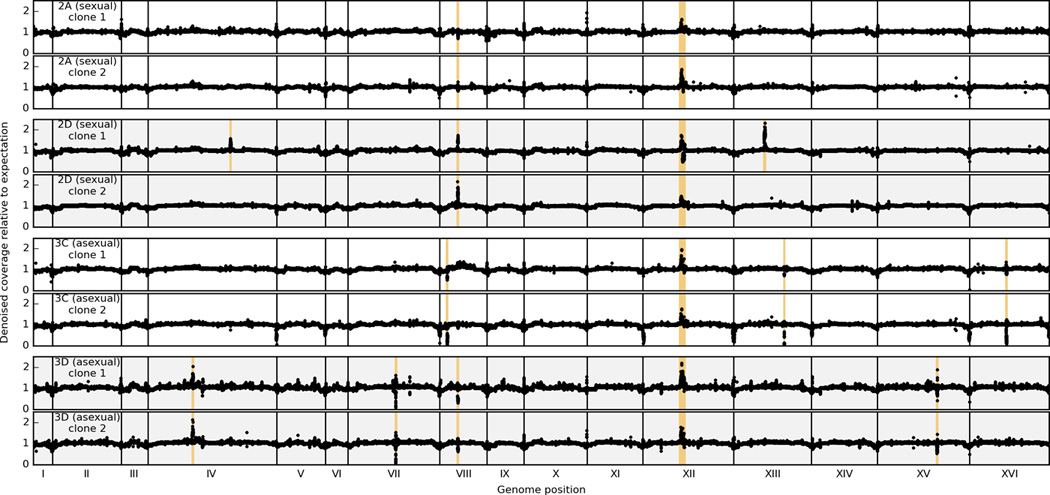
Extended Data Figure 4. Read-depth variation analysis of sequenced clones.

Denoised, normalized coverage in 100bp windows along the genome (Methods). Each panel represents a clone isolated from one of 4 independent populations. Pairs of clones from the same population are adjacent and indicated by the population label on the left. Regions containing putative amplifications and deletions (Extended Data Table 4) are highlighted in orange.
