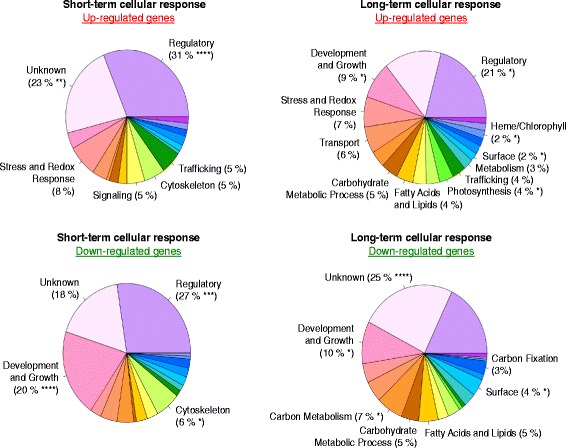
Fig. 2.

Functional categories associated with the genes up- and downregulated in response to iron deprivation. Pie charts representing the 19 functional categories defined in this work (see Additional file 3: Fig. S3 for a detailed description), with the percentage of genes assigned to each function. Only the functions for which the calculated enrichment p-value < 0.15 are noted. (****) indicates a p-value < 0.0001, (***) indicates a p-value < 0.001, (**) indicates a p-value < 0.01 and (*) indicates a p-value < 0.05
