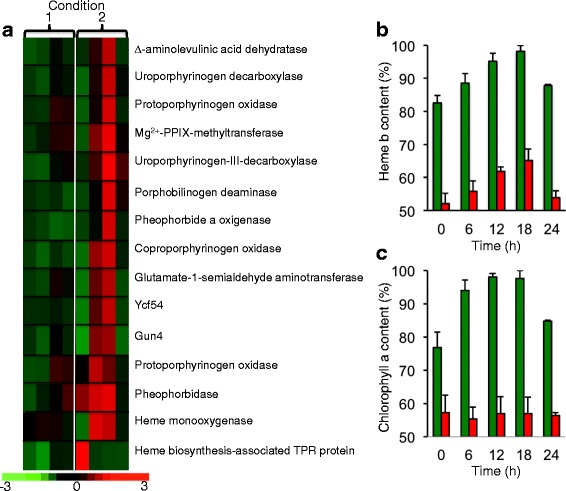
Fig. 6.

Cell response to iron deprivation in terms of tetrapyrrole metabolism. a Clustering of data showing differential expression of the genes involved in tetrapyrrole synthesis and degradation in two sets of experimental conditions. Results are expressed (according to the color scale) in log base 2, as logFC [−Fe]/[+Fe]. b Heme b content of cells over a 24-h period, after one week of adaptation to iron-rich (green) or iron-poor (red) conditions (experimental condition 2). c Chlorophyll a content of cells over a 24-h period, after one week of adaptation to iron-rich (green) or iron-poor (red) conditions (experimental condition 2)
