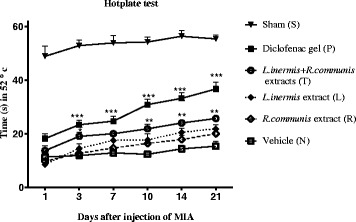
Fig. 5.

The response latency time of the paws to heat stimulation in hotplate test. The response latency time of the paws was measured at 1, 3, 7, 10, 14, 21 days after injection MIA compared to group (N) in each group. The latency values were increased after 10 days in group (T) and after 3 days in group (P). Data are expressed as mean ± SEM; *p < 0.05, **p < 0.01, ***p < 0.001 compared to group (N)
