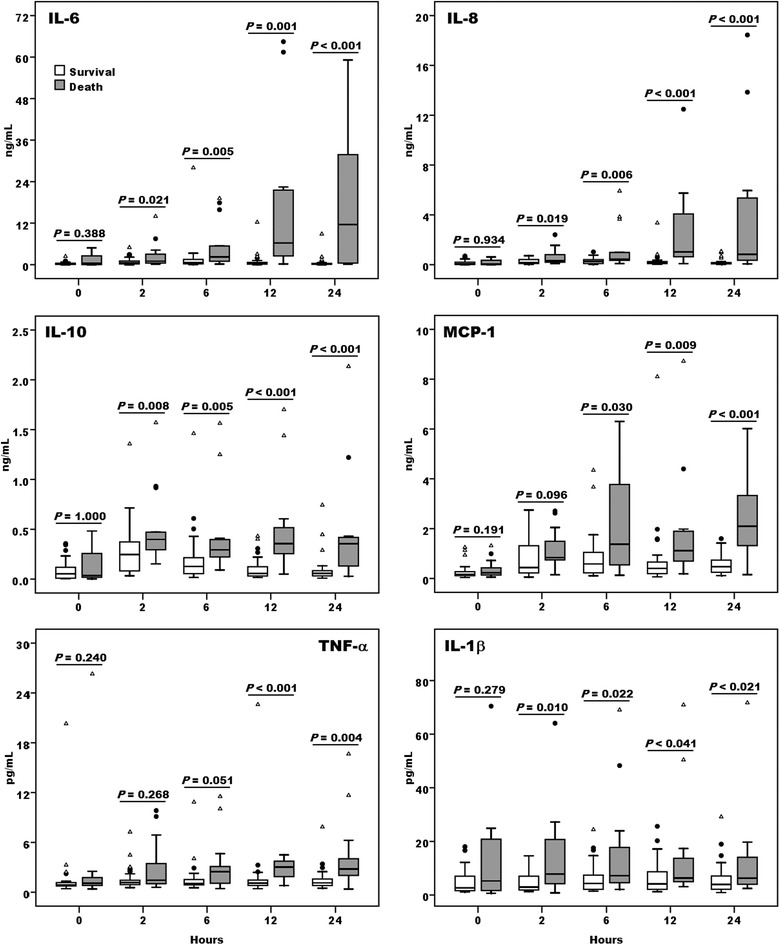
Fig. 3.

Comparison of inflammatory cytokine profiles between survivors and non-survivors who received ECMO support. Plasma IL-6, IL-8, IL-10, monocyte chemotactic protein-1 (MCP-1), tumor necrosis factor-α (TNF-α), and IL-1β levels were assessed among survivors (n = 32, open boxes) and non-survivors (n = 14, grey boxes) at the indicated time points after implement of ECMO support. Data represented the median and interquartile range of each group, while solid circle and open triangle indicated mild and extreme outliers respectively. Statistical differences between groups were analyzed by Mann–Whitney U test
