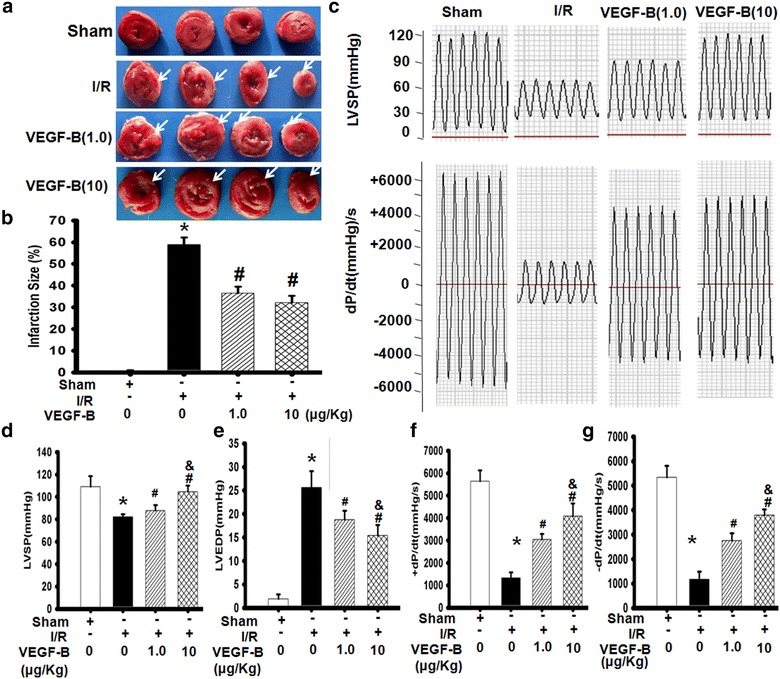
Fig. 1.

VEGF-B improved heart function in a myocardium I/R model. a TTC-stained myocardium 24 h after reperfusion. The white arrows indicate the infarct area of heart. b Infarction size in each group. The infarct size was expressed as a percentage of the left ventricular size for each heart. *P < 0.01 vs. sham group; # P < 0.01 vs. I/R group, n = 6. c Typical image of heart function. 24 h after reperfusion, LV function was measured as described in the “Methods” section. LVSP-left ventricle systolic pressure (d); LVEDP-left ventricle end-diastolic pressure (e); ±dp/dt max-rate of the rise or fall of left ventricular pressure (g and h). *P < 0.01 vs. sham group; # P < 0.05 vs. I/R group; & P < 0.05 vs. VEGF-B (1.0) group, n = 6
