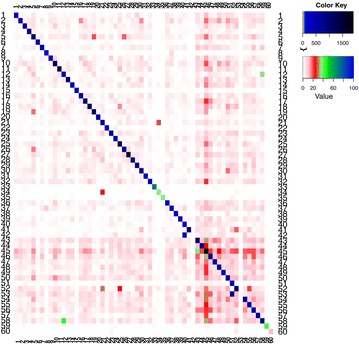
Fig. 4.

Heat map of the occurrence of tag combinations from dataset 2–pool 1. Rows are the forward tags and columns are the reverse tags ids. Colours ranging from white to light blue represent sequence copy numbers from 0 to 100, derived from identified sequences with unused tag combinations. Colours ranging from dark blue to black represent high copy numbers (>100, up to thousands), usually from sequences with the matching tag combinations intended in the laboratory set up
