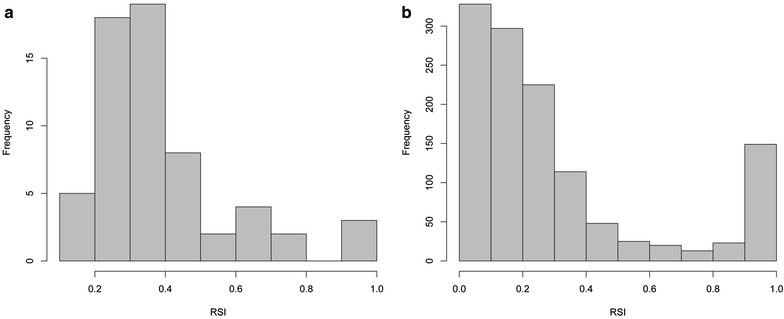
Fig. 5.

Renkonen similarity index values distributions of the pair-wise comparisons of the PCR replicates from dataset 1 and 2. a RSI values distribution of dataset 1. b RSI values distribution of dataset 2. A value of 0 means that the sequences are identical, and 1 means that there is no sequence shared between the PCR replicates
