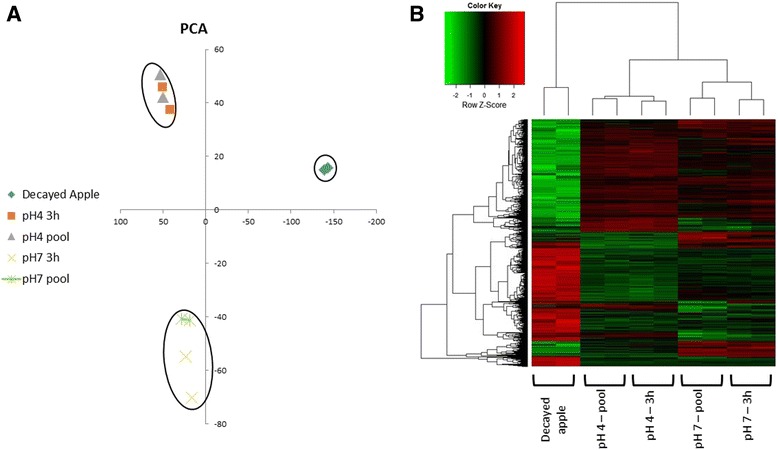
Fig. 1.

Principal component analysis (PCA) and heat map analysis of all the samples: duplicates of leading edge of inoculated apple; duplicates of pooled samples from all time points treated in vitro at pH 4.0; two replicates of P. expansum mycelia treated in vitro at pH 4.0 for 3 h; duplicates of a pool of samples from all time points treated in vitro at pH 7.0; and two replicates of P. expansum mycelia treated in vitro at pH 7.0 for 3 h. a PCA based on 5,646 differentially expressed genes. The results are plotted as: (♦) decayed apple; (■) in vitro at pH 4 for 3 h; (▲) pooled samples at pH 4; (X) in vitro at pH 7 for 3 h; (ӿ) pooled samples at pH 7. Circles are drawn around clustered points. b Expression heat map of differentially expressed P. expansum genes in the various samples
