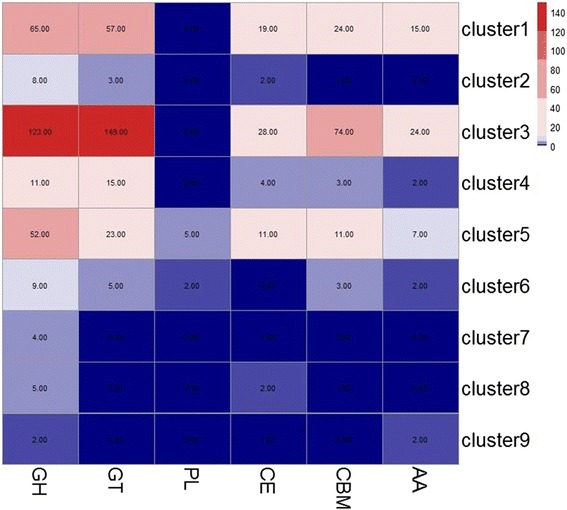
Fig. 5.

Comparison of the CAZyme repertories identified in each cluster of co-expressed genes. Enzyme families are represented by their class (GH-glycoside hydrolases; GT-glycosyltransferases; PL-polysaccharide lyases; CE-carbohydrate esterases; and CBM-chitin-binding modules) and family number according to the Carbohydrate-Active Enzyme Database. Abundance of the various enzymes within a family is represented on a color scale from 0 (dark blue) to 150 occurrences (dark red) per cluster
