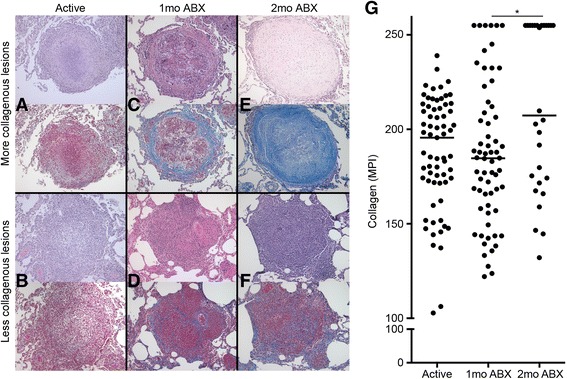
Fig. 2.

Granulomas exhibit range of collagen deposition before and after drug treatment. Representative sections of histology from granulomas pooled from two TB chemotherapy studies [40, 42], each with H&E staining (top panel) and Masson’s trichrome staining (bottom panel) for the same lesion. a Granuloma from active disease with some peripheral fibrogenesis. b Granuloma from active disease with no apparent collagenization. c Granuloma from 1-month drug-treated animal with robust peripheral fibrotic cuffing. d Granuloma from 1-month drug-treated animal with some central fibrous organization. e Fibrotic granuloma from 2-month drug-treated animal. f Granuloma from 2-month drug-treated animal with pervasive central fibrous organization. g Quantification of all Masson’s trichrome sections. Median pixel intensity was calculated from the blue channel of each micrograph and plotted by stage of drug therapy. Bars in each column represent medians. Kruskal–Wallis test: p = 0.0285. *p < 0.05
