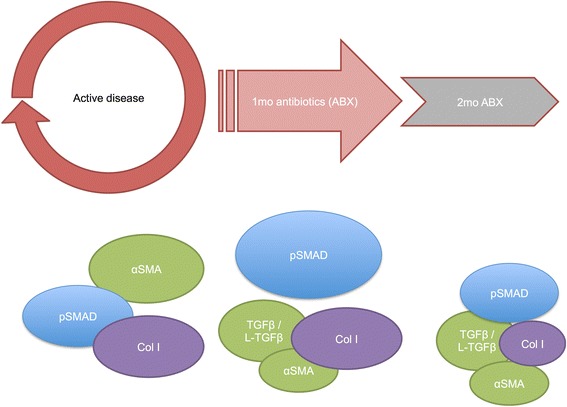
Fig. 7.

Model that demonstrates the TGFβ-associated processes explores in this study. The red arrow around active disease represents processes that activate fibrotic cytokines, which then diminish during the early course of drug therapy (smaller arrows that are less red). αSMA and TGFβ drop, represented in green, while pSMAD-2/3 appears to rise and fall, in blue. Levels of collagen I do not change, shown in purple
