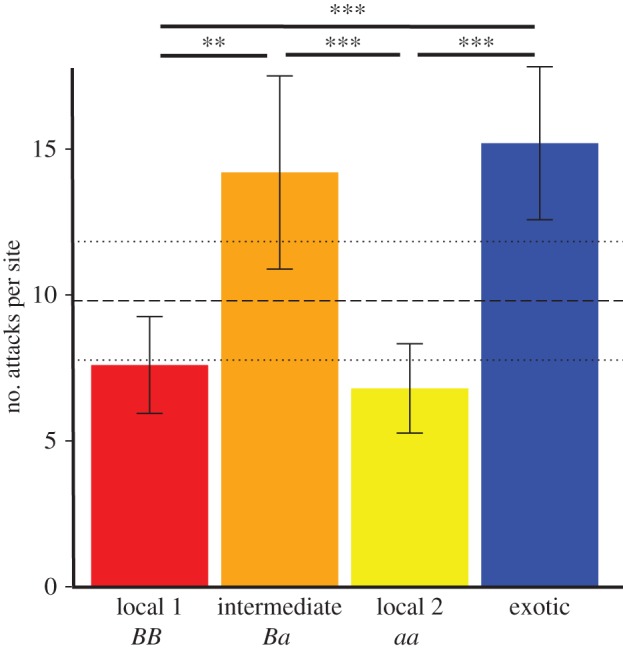
Figure 2.

Mean and standard error of the number of attacks per site registered for the two local homozygous phenotypes, the heterozygous phenotype and the exotic phenotype. Bars with asterisks at the top refer to significant comparisons in the number of attacks between H. numata forms. The dashed line represents the media of attacks registered on the palatable models, and the dotted lines represent its standard error (**p < 0.01, ***p < 0.001).
