Figure 2.

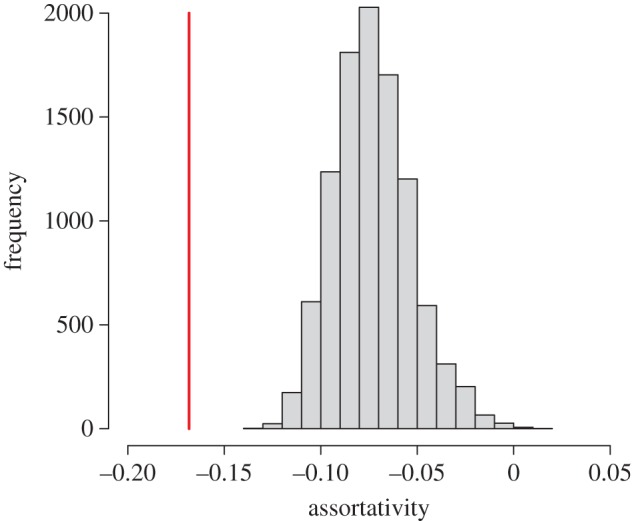
Average assortativity of all observed networks (red vertical line) is significantly smaller than the average assortativity of each of the 10 000 sets of randomized networks (histogram). (Online version in colour.)

Average assortativity of all observed networks (red vertical line) is significantly smaller than the average assortativity of each of the 10 000 sets of randomized networks (histogram). (Online version in colour.)