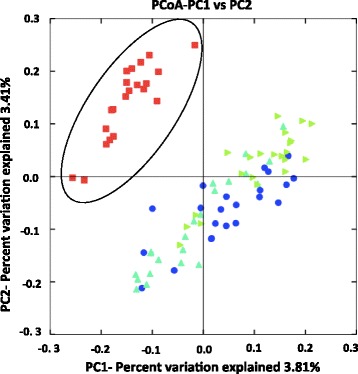
Fig. 1.

Principal coordinate analysis (PCoA) of rumen methanogen 16S rRNA sequences across a lactation. The PCoA demonstrates the clustering of 16S rRNA sequences from Holstein (n = 7), Jersey (n = 8), and Holstein-Jersey crossbreed (n = 7) cows at 3, 93, 183, and 273 days in milk (DIM). Red squares represent 3 DIM, the blue circles represent 93 DIM, mint green triangles represent 183 DIM, and light green triangles represent 273 DIM
