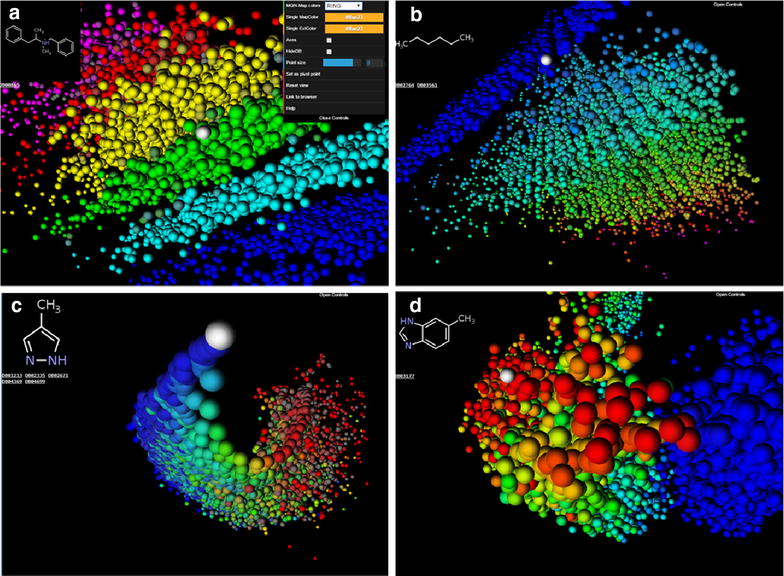
Fig. 2.

Color coded 3D-spaces of the DrugBank chemical space obtained by taking snapshots from the webDrugCS website (www.gdb.unibe.ch). The color changes in the range blue → cyan → green → yellow → red → magenta with increasing property value. a MQN 3D-space color coded by ring count, shown with open control panel b SMIfp 3D-space color coded by the number of aromatic carbon atoms. c APfp 3D-space color coded by rotatable bond count. d Sfp 3D-space color coded by the fraction of aromatic atoms. The molecule shown in the viewer window is located in the mouse over pixel, which is marked as a white sphere in the image
