Fig. 4.

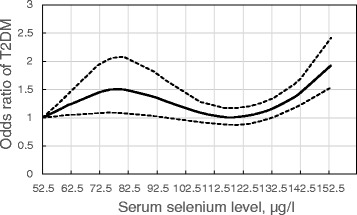
Nonlinear dose–response relationship between selenium and T2DM. The middle line represents the odds ratio of T2DM compared with reference (53.5 ug/l), and the upper and lower lines represent 95 % CI of the odds ratio

Nonlinear dose–response relationship between selenium and T2DM. The middle line represents the odds ratio of T2DM compared with reference (53.5 ug/l), and the upper and lower lines represent 95 % CI of the odds ratio