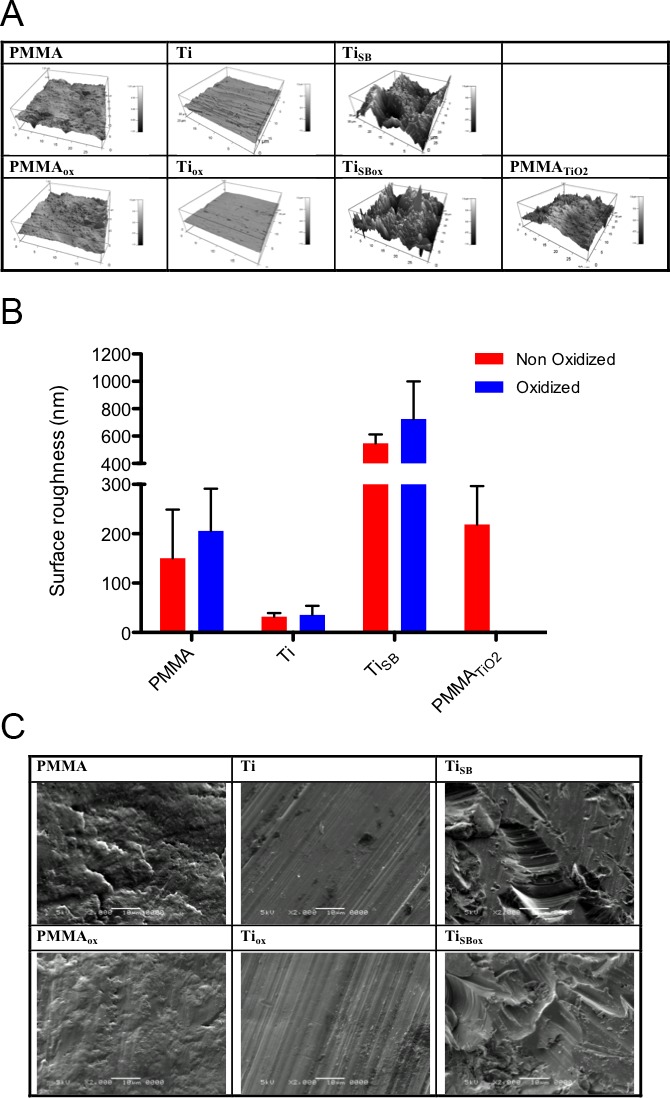
Figure 3.

Surface imaging. (A) Atomic force microscopy imaging provided quantitative data on the surface topography and roughness of the materials, summarized in (B) the graph. Data are means ± SD (N = 4, t-test). Oxidation did not show any statistical differences in any of the materials (P > 0.05). (C) Scanning electron microscopy of materials before (top row) and after plasma oxidization (bottom row).
