
Fig. 3.
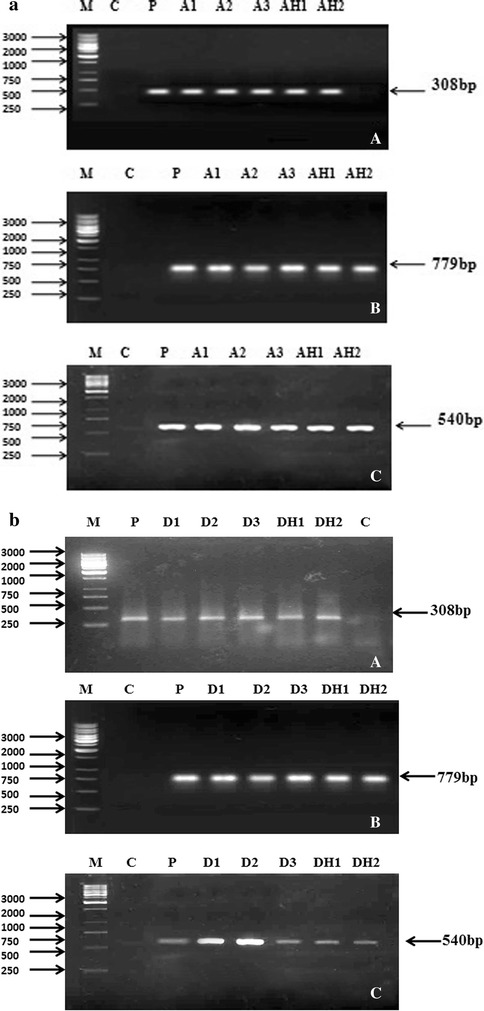
PCR analysis showing amplified products (a) A1–A3 represents the plants transformed by Agrobacterium tumefaciens and AH1–AH2 represents the plants transformed by Agrobacterium rhizogenes in Artemisia annua (b) D1–D3 represents the plants transformed by Agrobacterium tumefaciens and DH1–DH2 represents the plants transformed by Agrobacterium rhizogenes in Artemisia dubia. Lane P represents the plasmid DNA. Lane C refers to the non transformed control plants. Lane M corresponds to 1 kbp Ladder (Fermentas)