Fig. 3.
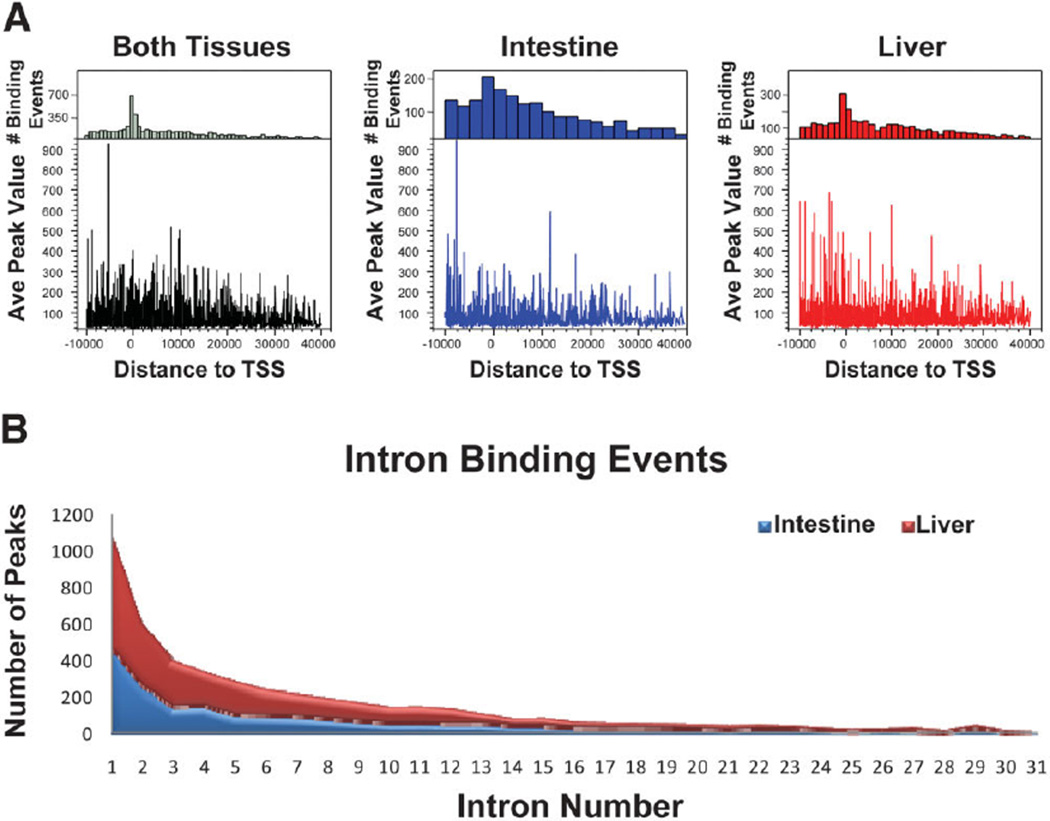
Distribution of total FXR binding sites relative to TSSs and intron binding of FXR. (A) The top panel is the frequency distribution of FXR binding, showing the number of binding events (y-axis) at each distance from TSSs (x-axis). The bottom panel displays average peak value of binding sites at each distance from TSSs. The y-axis displays the average peak value and the x-axis shows the distance of binding site from the TSS. The highest number of FXR binding events was greatest at the TSSs of genes, and the average peak value of FXR binding sites was greatest within 10 kb upstream of TSSs of genes. (B) The cumulative binding events of FXR distributed only to introns of genes in the liver (red) and intestine (blue). The graph displays the total number of FXR binding peaks (y-axis) in the liver and intestine located within intron 1–31 of genes (x-axis). There were a higher number of peaks within the first intron of genes, with 1107 total peaks within first intron for both liver and intestine.

