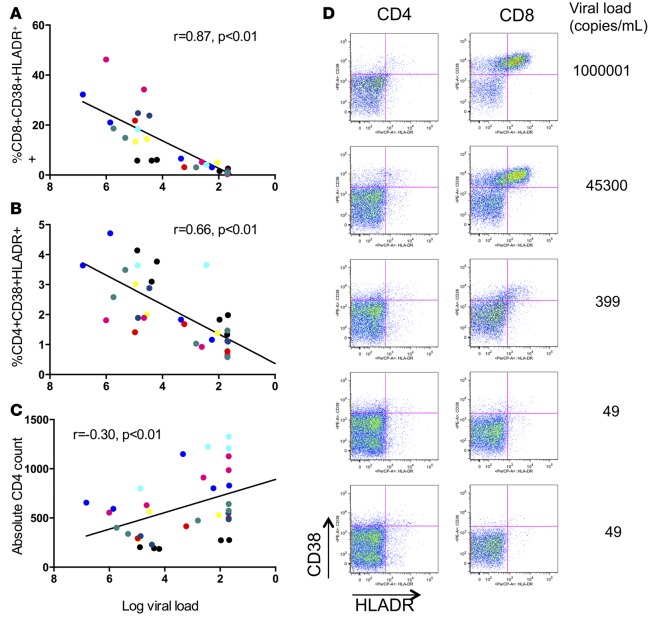
Figure 1. T cell activation correlates with declining viral load.
CD8+ (A) and CD4+ (B) T cell activation as defined by CD38 and HLA-DR coexpression correlated with declining viral load after initiation of ART. (C) Representative flow cytometric results for T cell activation with corresponding plasma viral load measures. (D) Recovery of CD4+ T cell count as related to viral load. Each color represents the measures for an individual patient over time (n = 8). r and P values for rank-based relationship, accounting for repeated measures.

