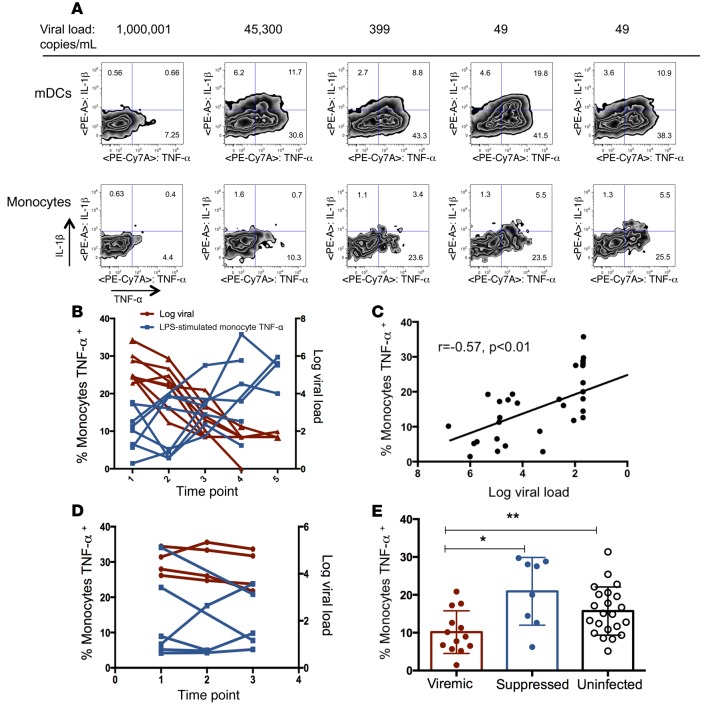
Figure 2. Cytokine production increases as viral load declines with ART.
(A) Representative intracellular cytokine staining of monocytes and mDCs following LPS stimulation for a single individual over a range of viral load measurements (n = 8 individuals total, with 35 individual time points analyzed). (B) Monocyte TNF-α production after LPS stimulation increased (left y axis, blue line) as viral load declined (right y axis, red line). (C) Monocyte TNF-α production after LPS stimulation correlated with plasma log viral load (rank-based statistics). (D) PBMCs from untreated, HIV-1–infected subjects did not show a pattern of change over time in cytokine secretion following LPS stimulation in vitro. Monocyte TNF-α production after LPS stimulation (blue line, left y axis), log viral load (right y axis, red line). (E) Comparison of monocyte TNF-α production in samples from a single viremic and a single suppressed time point per subject with monocyte TNF-α production in uninfected control subjects. *P < 0.01 and **P = 0.02, by Mann-Whitney U test. Data represent the mean and SD. ART, antiretroviral therapy; mDCs, myeloid DCs; PBMCs, peripheral blood mononuclear cells.

