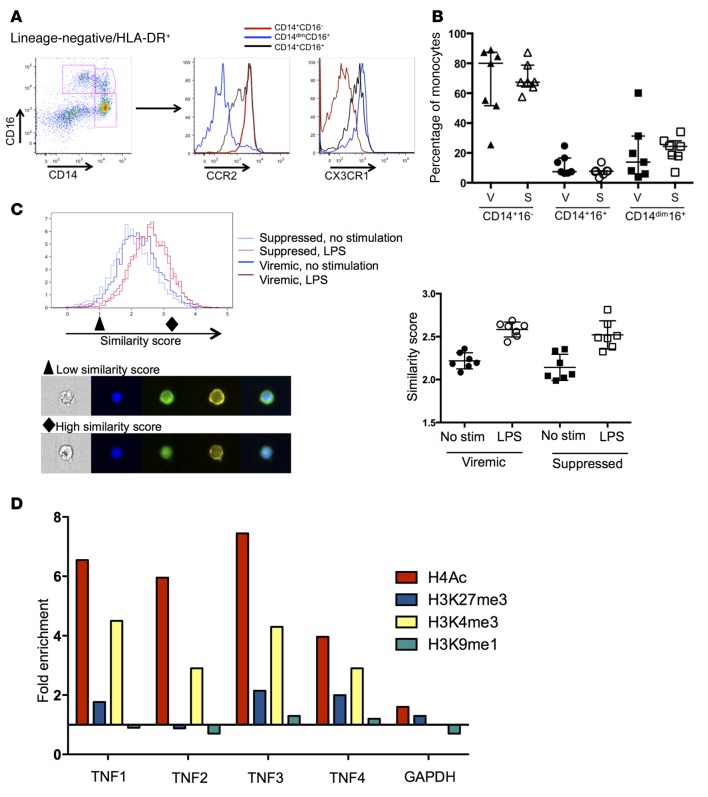
Figure 4. Monocyte populations from viremic and suppressed samples are identical in subset distribution and NF-κB translocation but show distinct epigenetic programs.
(A) Monocyte subsets were identified by CD14 and CD16, and homing potential was assessed by CCR2 and CX3CR1. (B) No significant differences in monocyte subset distribution between viremic and suppressed time points were noted (n = 7 individuals for all). S, suppressed; V, viremic. (C) Nuclear localization of NF-κB in CD14+ monocytes was assessed by ImageStream at baseline and after LPS stimulation. Both viremic and suppressed samples showed substantial nuclear translocation after LPS stimulation, as reflected by an increase of similar magnitude in the similarity score for both samples (right panel, P > 0.05, by Mann Whitney U test). Representative images from a low (black triangle) and high (black diamond) similarity score are shown. From left to right (original magnification, ×40): bright-field image; blue = DAPI nuclear stain; green = NF-κB; yellow = CD14; merge. (D) ChIP for specific histones, followed by qPCR for regions of the TNF-α promoter identified significant enrichment of H4Ac and H3K4me3 across the promoter. Data represent the fold change in suppressed samples compared with viremic samples. Data shown are representative of 1 of 3 experiments; summary data are shown in Supplemental Figure 3. qPCR, quantitative PCR; stim, stimulation.

