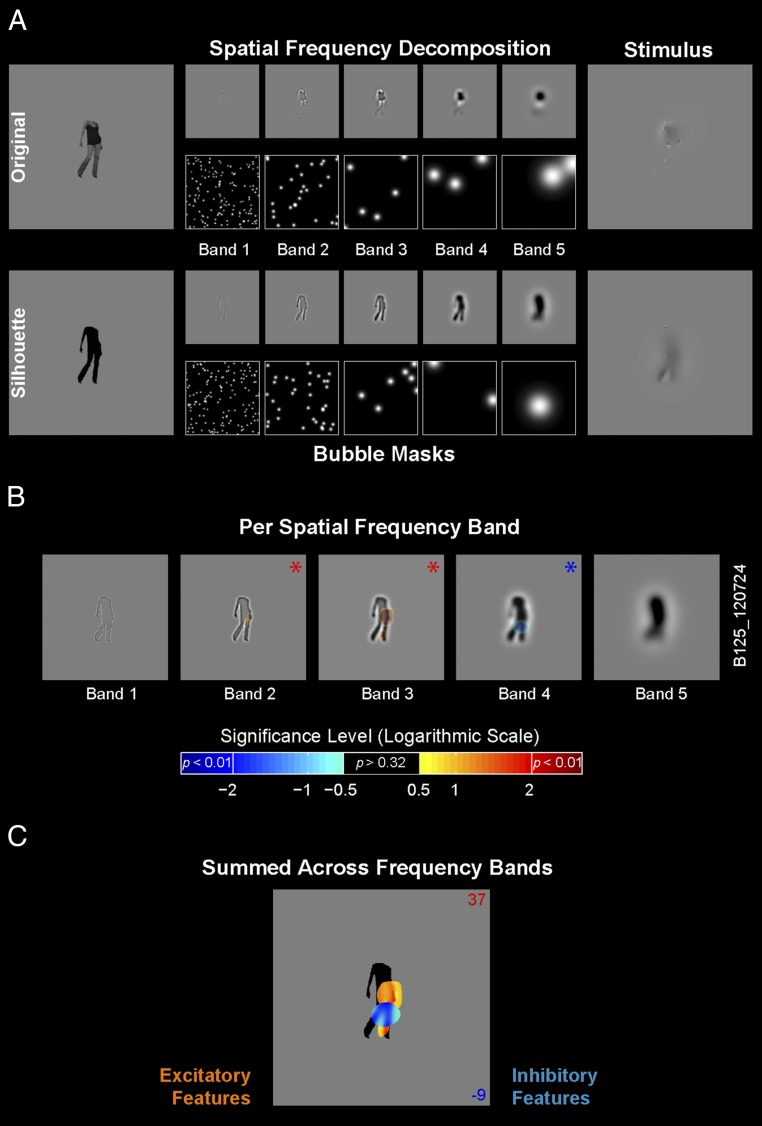
Fig. 1.
Bubbles: procedure and single neuron example. (A) Procedure for original and silhouette stimuli. We decomposed the original and silhouette image into five nonoverlapping SF bands (bands 1–5) of one-octave bandwidth. Gaussian apertures (bubbles) positioned at random spatial locations within each band sampled different fragments of the spatially filtered image. We scaled bubble size and number across bands. The stimulus comprised the image fragments summed across SF bands. For display purposes in this figure (but not in the actual stimuli), we adjusted the contrasts for each band. (B) Bubbles results from one example neuron tested with the silhouette of a human body, plotted per SF band. Classification images [signed significance level of difference scores (DS), logarithmic scale] are overlaid at each SF band. The sign of the logarithm corresponds to the sign of DS (positive excitatory fragment indicated in red; negative inhibitory fragment indicated in blue). Red and blue asterisks denote significant positive and negative DS, respectively, in this band (P < 0.01). DS values with P > 0.32 are not displayed. (C) Bubble results for the same example neuron where the band-passed image fragments that included a significant DS in a band were summed across SF bands and are shown on top of the silhouette image. The color of the blobs corresponds to the sign of DS (positive excitatory fragment indicated in orange; negative inhibitory fragment indicated in blue). The two numbers in the right top and bottom corners indicate the mean net firing rates (in spikes per s) for the high (16% top; red) and low (16% bottom; blue) response trials, respectively.

